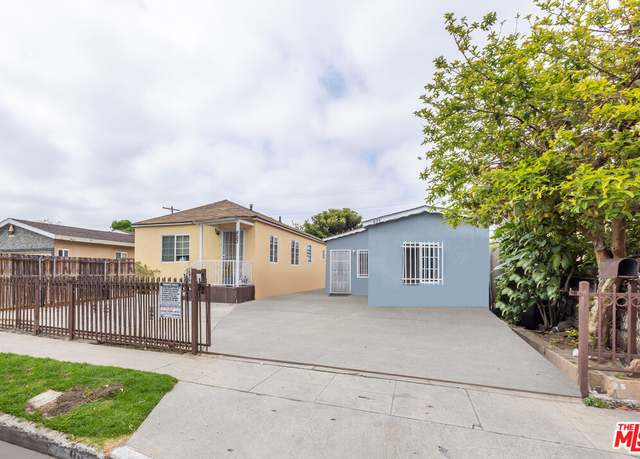
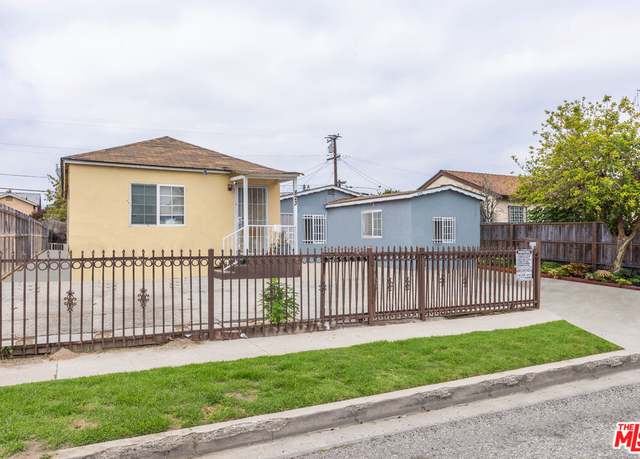
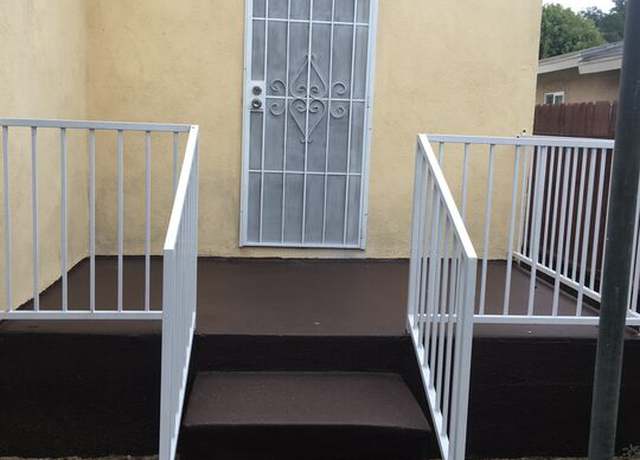
Presenting an outstanding opportunity: a gated duplex comprising two charming freestanding homes, each boasting its own unique features. One house offers 3 bedrooms and 1 bath on a slab foundation, while the other features 2 bedrooms and 1 bath on a raised foundation. Both homes enjoy spacious private backyards shaded by lush fruit trees, including guavas, avocados, apples, and mandarines, creating a serene and picturesque atmosphere for comfortable living. The 3-bedroom house showcases faux wall paint, beautiful floor tiles, and an inviting eat-in kitchen with laundry hookups. Meanwhile, the 2-bedroom house features an eat-in kitchen, laundry room, and a back porch leading to the backyard.
Introducing an exquisite opportunity that's sure to impress! Once a model home, this elegant 3-bedroom, 2-bathroom townhouse offers charm and sophistication, with only one shared wall for optimal privacy and tranquility. This home feels like a house. Nestled in a gated and meticulously maintained community a few steps from the pool and lush greenery, this residence promises a serene lifestyle. Step through your own spacious outdoor patio, shaded by mature trees, ideal for hosting barbecues or enjoying quiet moments with loved ones. The inviting open floor plan on the main level encompasses a living room, kitchen, dining area, and full bathroom. Upstairs, all three bedrooms offer stunning vi
Investment Opportunity!! This well-maintained fourplex offers excellent potential for investors seeking strong returns Built in 1953, the property consists of three buildings: * * * Unit (A) is a 3 bed & 1.75 bath house with its own backyard and attached one car garage * * * Unit B: Is a comfortable 2-bedroom, 1-bathroom unit * * * Units C & D: Are two charming 1-bedroom, 1-bathroom units Reposition and unlock additional revenue with proforma rents almost doubling current income! Additional opportunity also exists with the 580 sq ft garage. Currently used for storage, it has the potential to be converted into an Accessory Dwelling Unit (ADU), gener
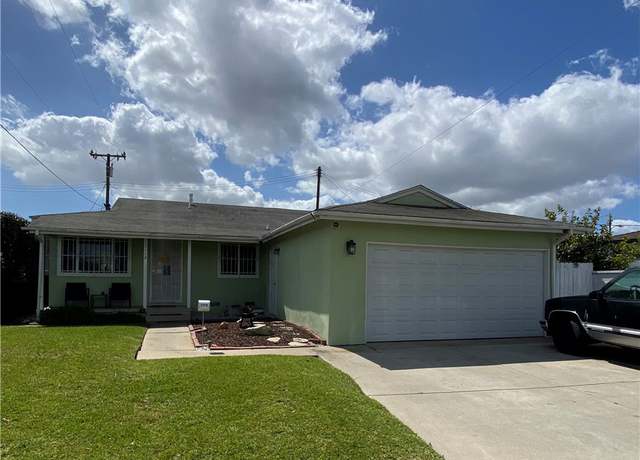
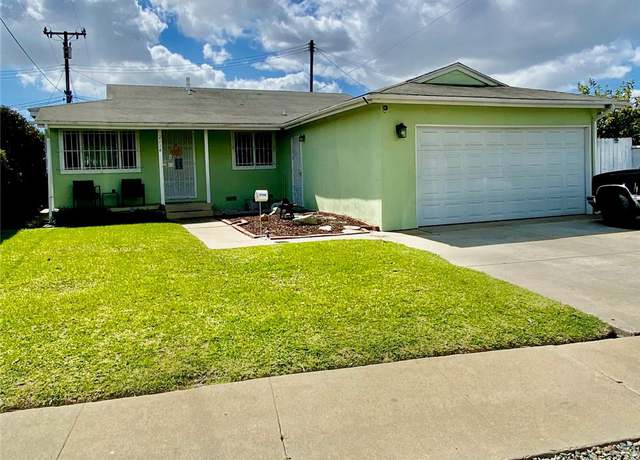
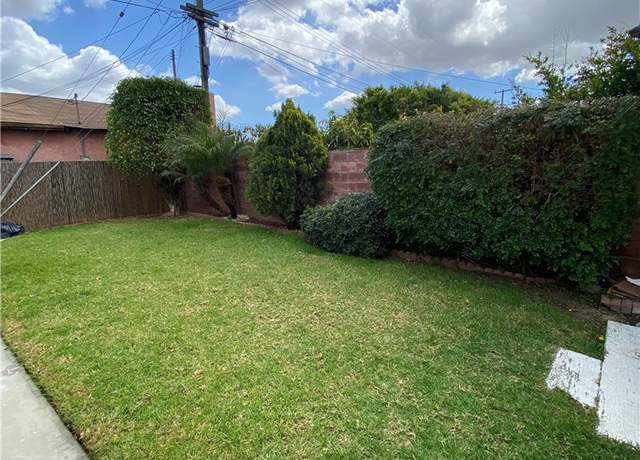
LARGE STARTER HOME! MOVE IN CONDITION. WOOD FLOORING IN LIVING ROOM AND BEDROOMS. TILE FLOORING AND VANITY IN BATHROOMS. EATING AREA OFF KITCHEN. KITCHEN WITH TILE COUNTERS AND FLOORS, DISHWASHER, GAS COOK TOP, VENT HOOD AND BUILT-IN OVEN. FORCED AIR HEATING AND INCLUDES 2 CAR ATTACHED GARAGE. FRONT LAWN WITH SPRINKLERS. ENCLOSED PATIO - PERFECT FOR GET TOGETHERS!
Welcome to your mid-century modern retreat! This 3-bedroom, 2-bathroom home offers 1498 sqft of stylish living space. Step inside and be greeted by the warmth of engineered wood floors and the charm of exposed beams throughout. The oversized galley kitchen is a chef's dream, featuring ample counter space and storage. The vaulted ceiling in the family room adds to the spacious feel, while large windows flood the home with natural light, highlighting the mid-century modern design. Unwind in the primary bedroom, complete with a luxurious soaking tub. Step outside to your private patio, where a covered pergola provides the perfect spot for outdoor dining or relaxing. A covered carport offers sp
This property consist of 4 bedrooms, which includes a very extra large master bedroom that has a great size walk-in closet and 2 full bathrooms. There is also a bonus room attached to the rear of the detached two car garage, which has be turned into ADU. The home has an extra long driveway and carport for additional parking. It has newer plumbing and electrical throughout. Come take a look at this home today, as it will make a perfect home for a large family.
Welcome to 2525 135th Street and 2527 135th Street. This home is being used as 3 units, on 2 lots. The home located at 2525, features a welcoming and private curb appeal, newer exterior and interior paint, laminate floorings, and a remodeled kitchen. In addition, the home has a newer roof, and updated double pane windows. The primary suite, has newer laminate flooring, and the primary bathroom was just recently remodeled, 6 months ago. There are 3 additional rooms, with a bonus room, and a laundry area. The home labeled as 2525 1/2, has it own separate entry door. This unit has a bedroom area, kitchen area, and bathroom. Adjacent to this unit, is unit 2527. This unit also has its own kitch
Beautifully remodeled 4 bedroom property which includes 2 master suites with on suite bathrooms. The property has a total of 3 full bathrooms. The living room has a 20 foot ceiling with a stone fireplace and modern recess lighting throughout the house. The kitchen has a beautiful large island which is open to the living room. There is an area for a dining room table and a breakfast knook all within the oversized kitchen. The kitchen includes a tasteful backsplash and a glass hood to stay with the modern look. Throughout the front of the house there are windows everywhere which gives great light. The open floor plan takes you down a center hallway that has 2 linen closets and a laundry area
What a Deal! One Story Family Home in Los Angeles, Features 3 Bedrooms and 1 Bathroom, Spacious open floorplan, Living Room and Kitchen. The Kitchen has tiled floors, countertops, Lots of cabinet space, and Appliances. Down the Hall are the bedrooms, bathroom and Laundry Closet. Bedrooms are a great size and have ceiling fans, Large rear yard, plenty of room for entertaining, Detached One Car Garage with Covered carport/Patio area and long driveway. Bring your imagination to this one, Close to Shopping, Schools and more.
Welcome to this charming 2 bedroom 1 bath home. Perfect for a first time buyer or investor. This home sits on a spacious lot, with a detached garage. There's Enough space to add an ADU. The possibilities or endless. Sold As Is, in need of some TLC.
We are pleased to present 12240 Santa Fe Ave, a six unit apartment building to market in Lynwood, CA. Santa Fe Ave consists of six one bed/one bath units that are approximately 600 square feet each on a 7,316 square foot lot that includes a five car garage in the rear of the property. The property has undergone extensive exterior renovation including a newer roof on the main main structure and garage, new exterior paint, new vinyl double pane windows, new garage doors, and mini split conditioners for all the units. One of the units has been fully renovated as well with vinyl plank floors, new bathroom, and a new kitchen. The property is separately metered for electric and gas. With rents 40
THIS DUPLEX FEATURES A 2 BEDROOM 1 BATH EACH. PROPERTY NEEDS LOTS OF WORK AND HAD GREAT POTENTIAL FOR ALL INVESTORS. ALL AGENTS AND THEIR CLIENTS TO VERIFY ALL INFORMATION WITH CITY. CALL TO SET UP AN APPOINTMENT FOR SHOWING.
Introducing this FULLY renovated charming 2-bedroom, 1-bathroom home with tons of outdoor space and plenty of parking in the 2-car garage, driveway, backyard, behind the garage with easy ALLEY access through ROSECRANS AVE. The detached garage was reconstructed to its original 2-car garage with a new automatic garage door/motor and washer/dryer hookups (Once used as unpermitted conversion) inside. Still, accessible utilities were caped for future ADU owners. This home boasts a remodeled kitchen with granite countertops, new cabinets, and appliances. Also, the NEW 220 V home's electrical box, outlets (surge protector & tamper resistance), and new electrical wiring were upgraded to the a
Property has been owned for over 60 years. Located in the heart of Compton, surrounded by shopping centers and schools. This home needs some TLC and repairs. Property being sold in its as is condition, with no warranties by the sellers.
Great Spanish Style-gem! This charming home offers 3 spacious-bedrooms, 1 bath. Enjoy an open concept living area that flows seamlessly. Spanish arch dining room with ceiling fan. Spacious Kitchen with breakfast nook area, with a convenient door leading to the backyard. For those who value versatility, this property boasts an unpermitted converted 2 bedroom, 1 bath garage with a generously wide private driveway. Whether you're seeking additional living space, a source of rental income, this option greatly enhances the property's value. Corner lot, perfect for you to park your RVs, boats and multiple cars, and the backyard offering an ideal place for gatherings and relaxation. Conveniently l
First-time buyer's dream! Stylish tri-level detached townhouse in the Emerald Village gated community. 3 bedrooms 3 bathrooms, over 1,700 SF living space. One bed room and bath down stairs could also make a great client friendly office space. Laundry accommodates full size side-by-size washer and dryer. Spacious second floor finds high ceilings, good-size open kitchen with great lighting from large widows, sizable pantry, plenty cabinets, barstool counter plus area for a big breakfast table, partitioned dining area, huge living room with a view, fireplace and entertainment nook. Top floor, second bed room, full bathroom, and primary suite with a view, also has walk-in closet with shelving.
This 3-unit property in Compton presents an ideal investment opportunity for investors looking to add value through renovation. The property consists of three units - the front unit features 2 bedrooms and 1 bathroom, the middle unit offers 2 bedrooms and 1 bathroom, and the last unit includes 1 bedroom and 1 bathroom. While the property requires some tender loving care, its layout provides a versatile investment potential for rental income or resale after renovation. Located in Compton, a city with a diverse real estate market and proximity to amenities, this property offers a promising investment prospect for savvy investors.
Check out this corner lot with plenty room to add ADU's. Includes a library and an unfinished basement. Write offers subject to inspection. The owner will review offers on May 4, 2024. Do not disturb tenants. Repairs and upgrades in progress.
PROBATE, FULL AUTHORITY a prime fixer needs TLC. Great potential. A must-see property. The subject property is located on an interior, level, rectangular shaped site with square foot dimensions common to the area. The subject property backs to a house of worship-The subject property is located in a small, equestrian-oriented neighborhood in the City of Compton known as "Richland Farms". 1-story, average quality, detached single family residences. large with horse/animal facilities. Schools, parks, shopping, employment centers, freeway access and entertainment are located nearby. Subject's neighborhood is 1/4-1/2 mile Southeast of the Compton Airport (light aircraft)- Chain-link fe
Cozy 2 bedroom 1 bath home located in the county of Los Angeles, nestled on a spacious lot. Come with a visionary mindset to design this home the way you want! there's a separate garage that can be converted to an ADU (if desired). Located close to DMV, Post Office, freeways and transportation, and a large shopping center with all your favorite eateries and stores. You'll enjoy easy access to everything you need. Don't miss out on this amazing opportunity!
Beautiful THREE-bedroom, TWO-bathroom home with a remodeled ADU and a LARGE backyard! Just ready for a family to move in. This gem consists of a large living room that opens up to the dining area with laminate wood flooring throughout. A large kitchen with granite countertops and plenty of cabinet space. A separate area off the kitchen that perfect for a breakfast table or nook. THREE spacious bedrooms with a large master bedroom that leads to a large backyard and patio that is perfect for entertaining family and friends. A remodeled ADU with its own bathroom that is move in ready with laminate wood flooring and quartz countertops, beautiful cabinets and a tastefully done backsplash in the
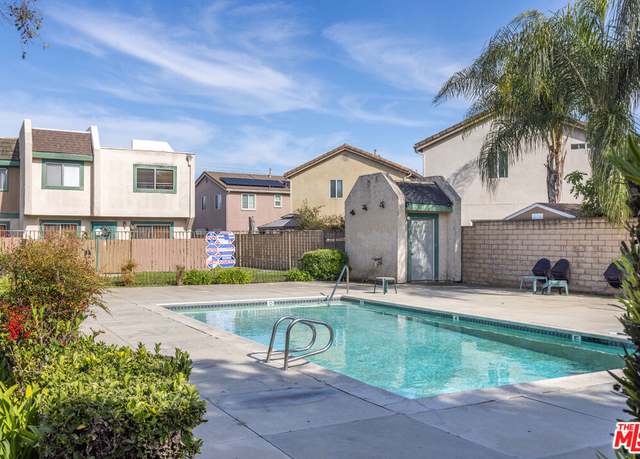
Great Opportunity for a First Time Homebuyer! This Townhome possess a 3bedroom 2bath 2story 2car garage, recent upgrades throughout private patio in the front gated entry. Enjoy a dip in the sparkling pool. Located near Metro rail, close to shopping and schools, So-Fi stadium & Downtown LA 15 to 20 minutes away.
Explore a charming condo just moments away from Wilson Park, offering an ideal haven for a growing family. This meticulously maintained residence boasts three bedrooms and three bathrooms, ensuring comfort and privacy for all. Upon entry, be greeted by a thoughtfully designed interior exuding contemporary elegance. The layout seamlessly connects the living, dining, and kitchen areas, creating a harmonious space for entertaining. The kitchen features sleek countertops and abundant storage options. Retreat to the inviting master suite, complete with a private en suite bathroom and generous closet space. Two additional bedrooms provide versatility for guests or as a dedicated workspace. Conven
Affordable 3BR/2BA Starter Home with Potential! Discover the perfect starter home with this cozy 3-bedroom, 2-bathroom residence. Ideal for first-time buyers, this property features a functional layout with separate living spaces, providing privacy and comfort for the whole family. The kitchen awaits your personal touch, offering a great opportunity for renovation to create a custom culinary space. With a cozy living room, freshly painted interior, and new carpets in the bedrooms, comfort awaits at every turn. The backyard, though in need of TLC, offers an outdoor area for potential gardening or play. Located in a convenient neighborhood close to schools, parks, and amenities, this home
* * * PRICE REDUCED * * * Welcome to this charming and spacious three bedrooms and 1.5 bathrooms in Compton, CA. Upon entering this turnkey home, you are greeted by a light filled living room. Ideal for relaxing and entertaining guests. This home features a functional layout, spacious bedrooms, updated bathrooms, new carpet and paint throughout the house. Inside laundry. The driveway has a covered 2 car carport and a great backyard for those outdoor summer nights. Located within minutes from freeway, shopping and schools. This home is ideal for both investors and families looking for a forever home in a vibrant community and promises a blend of lifestyle and growth potential. Don't mi
Welcome to your dream home! Nestled in a charming neighborhood, this stunning property invites you to experience contemporary elegance and comfort. Behold this beautifully remodeled 3-bedroom, 2-bathroom sanctuary boasting modern finishes throughout. As you step inside, be greeted by an inviting ambiance highlighted by abundant natural light cascading through large windows, illuminating the open-concept living spaces. The seamless flow from the living area to the dining space creates an ideal environment for entertaining guests or enjoying intimate family gatherings. The heart of this home is its impeccably designed kitchen, where culinary dreams come to life. Sleek countertops, stainless s
WOW!!!! WOW!!!! WOW!!!!!!! WOW!!!!!!!!! I AM PLEASED TO OFFER FOR SALE A SIX UNITS APARTMENT BUILDING THE PROPERTY IS CENTRALLY SITUATED FOR EASY ACCESS TO COMPTON ESSENTIAL SERVICES WITH CLOSE PROXIMITY TO MAJOR HIGHWAYS AND PUBLIC TRANSPORTATION, COMMUTING IS CONVENIENT, OFFERING PERFECT BALANCE BETWEEN CITY LIFE AND TRANQUILITY SITUATED ON A 5830 SQFT PARCEL, THE PROPERTY IS COMPRISED OF 4 UNITS WITH 2BEDROOMS AND 1 BATH AND 2 MORE UNITS OF 1 BEDROOM AND 1 BATH WITH A 6 PARKING SPACES AND OVER 4,000 OF LIVING SPACE TOTAL ALSO THERE IS ROOM FOR THE RENT TO BE RAISE SINCE IT DOES NOT FALL ON THE RENTAL CONTROL AREA THIS PROPERTY FALLS UNDER THE UNINCORPORATED AREA OF COMPTON
Single-family home with great curb appeal in a quiet, established neighborhood. This is a 3-bed, 2-full bath home with a formal dining room and room outside to entertain, garden and enjoy the California sunshine. This is a family home that has been passed down through generations. It is ready to become home-base for a new family.
This single family home has 4 bedrooms, 2 bathrooms, Corner lot . It comes with tenants in possession, Seller will not do any repairs or termite, Home sold As-IS , major Rehab/repairs needed. Cash Only, will not qualify Financing. Do not disturb the Tenants, Shown by appointment.
very quiet neighborhood and bright area. face north. walking distance to Dickion elementary, Benjamin o. Davis middle schools. remodeled kitchen and bathrooms. Completely remodeled whole house(New kitchen with mini dishwasher and trash compactor. new laminate wood flooring, new window and wood shuttles, iron fence and automatic motor front gate door. Two car garage detached. Central heating and air condition.
BACK ON THE MARKET!! Buyer Could Not Perform!! … Motivated Seller let’s Open Escrow . .INCREDIBLE OPPORTUNITY!!! Like NEW built in 2020 GORGEOUS 2 story Newly constructed home in the heart of the southland . 3 bedrooms 2 and 1/2 bathrooms, upgraded vinyl Plank flooring, customized blinds specialty made throughout the home plus a 2 car garage. This is a well maintained pride of ownership home. Added BONUS - Solar Panels already installed and fully PAID OFF making this not only a beautiful home but a money SAVER . On top of that it was built Energy Star certified to be energy efficient as well as aesthetically pleasing with open kitchen and living room designs made for modern se
Turn-Key 5 bed, 2 bath home sitting on a corner lot, fully fenced, with an attached 2-car garage is ready to be made yours. This spacious home has tile and wood-look laminate flooring throughout, no carpet, and has many updates including fixtures and both bathrooms with pedestal sinks and walk-in showers with beautiful tile. The large living room flows into the eat-in kitchen with wood cabinetry, tile counters and backsplash. There are 2 bedrooms on the main floor and 3 more large bedrooms on the 2nd, as well as space for a desk at the top of the staircase. Enjoy the lush green grass in the front yard and pavement around the sides of the home, there is also an attached garage. Conveniently
Nice house located in friendly neighborhood with just minutes away from Freeway, shopping and schools. Perfect if you are looking for a low maintenance yard, but with ample space for family bbq. Home consists of 3 bedrooms which were already in place when current owner purchased the property. Garage is currently being used as an additional bedroom.
Discover the ideal home! This charming remodeled 3 bed 2.5 bath END UNIT is nestled in the sought after guard-gated community of Heritage Estates. Recently updated with new vinyl flooring downstairs, a gas fireplace, cozy carpeting upstairs, alongside granite countertops and modern shaker cabinets. Enjoy the convenience of in-home laundry and an attached 2-car garage. In the main bedroom you will find two closets including a spacious walk-in closet, and vaulted ceilings. Step onto your private deck to relax and enjoy the tranquil green park -like area. This pet friendly community offers two pools, two jacuzzis, a basketball court, and tennis court. Don't wait- schedule your appointment toda
Welcome to this stunning property with a natural color palette that creates a warm and inviting atmosphere. The kitchen boasts a center island, perfect for entertaining guests and preparing meals. With other rooms available for flexible living space, you have the freedom to customize the home to fit your needs. The primary bathroom offers double sinks and good under sink storage, allowing you to keep your essentials organized. Step outside to the fenced-in backyard, complete with a sitting area where you can relax and enjoy the beautiful surroundings. This home also features fresh interior paint and new flooring throughout, giving it a fresh and modern feel. Don't miss out on the opportunit
BACK ON THE MARKET! PRICE REDUCTION! Annual Rent: $74,400. Discover the allure of this expansive and charming duplex, presenting two units that can be configured to suit your preferences. Ideally situated within a mile of the recently established Walmart on Long Beach Blvd and the esteemed Compton courthouse, this residence boasts convenience with proximity to the 105 Freeway, the vibrant Crystal Casino & Hotel, and the bustling Plaza Mexico. Step into This property with two garages and plenty of covered parking space, the rear unit, where gleaming wooden floors provide an inviting warmth and contemporary appeal. Meanwhile, the front unit welcomes you with an open floor plan in the l
This area's enrollment policy is not based solely on geography. Please check the school district website for more information.
Elementary schools
Middle schools
High schools
GreatSchools Summary Rating
8/10
Laurel Street Elementary School
Public, K-8
8/10
Bursch Elementary School
Public, K-7
8/10
Mayo Elementary School
Public, K-8
8/10
Jefferson Elementary School
Public, K-8
7/10
Washington Elementary School
Public, K-8
Only showing 5 of
31 elementary schools.
School data is provided by GreatSchools, a nonprofit organization. Redfin recommends buyers and renters use GreatSchools information and ratings as a first step, and conduct their own investigation to determine their desired schools or school districts, including by contacting and visiting the schools themselves.Redfin does not endorse or guarantee this information. School service boundaries are intended to be used as a reference only; they may change and are not guaranteed to be accurate. To verify school enrollment eligibility, contact the school district directly.
Homes for sale in Compton have a median listing price of $650K. Some of these homes are Hot Homes, meaning they're likely to sell quickly.
What are some of the most popular neighborhoods in Compton?
Popular neighborhoods include Southeast La, East Compton, Harbor Gateway North, North Long Beach, Harbor, Rancho Dominguez, North Carson, Deforest Park, Victoria, and Section 48.
Compton, California offers a variety of transportation options, including a robust public transit system. The city is served by the Metro Blue Line light rail, numerous bus routes, and the Compton/Woodley Airport. For those who prefer to drive, Compton is intersected by the 91, 110, and 710 freeways, providing easy access to the greater Los Angeles area. However, like many Southern California cities, Compton can experience high levels of car traffic, especially during peak commuting hours. Learn more on our Compton city guide.
What types of properties are available in Compton?
Compton, California offers a variety of single-family home types, including ranch-style homes, bungalows, and contemporary residences, each with their own unique architectural features and designs. These homes can be found throughout the city, with many located in established neighborhoods and newer developments. Most properties in Compton, California feature two to four bedrooms and were built in various years. To explore different property types for sale in Compton, California, use the 'Home type' filter located above the active listings. Customize your search by selecting options like single-family homes, condos, townhomes, and more.
What is life like in Compton?
Compton, California offers a vibrant urban experience with a mix of residential and commercial areas. The landscape is characterized by a combination of bustling streets and residential neighborhoods. The weather in Compton is typically warm and sunny, providing an enjoyable climate year-round. The city presents a range of job opportunities, with a variety of industries represented. Residents can engage in a diverse range of activities, including shopping at local markets, exploring local parks, and participating in community events.
What are the schools and amenities like in Compton?
Compton, California offers a variety of public amenities to cater to the needs and interests of its residents. The city boasts numerous restaurants, providing a diverse array of culinary experiences. For those who enjoy outdoor leisure, there are several parks available for relaxation and recreation. Grocery stores are conveniently located throughout the city, ensuring easy access to daily necessities. Additionally, Compton provides other amenities such as libraries, fitness centers, and community centers, enhancing the quality of life for its residents.
In the past month, 27 homes have been sold in Compton. In addition to houses in Compton, there was also 1 condo, 4 townhouses, and 25 multi-family units for sale in Compton last month. Compton is a moderately walkable city in Los Angeles County with a Walk Score of 65. Compton is home to approximately 98,313 people and 28,078 jobs. Find your dream home in Compton using the tools above. Use filters to narrow your search by price, square feet, beds, and baths to find homes that fit your criteria. Our top-rated real estate agents in Compton are local experts and are ready to answer your questions about properties, neighborhoods, schools, and the newest listings for sale in Compton. Our Compton real estate stats and trends will give you more information about home buying and selling trends in Compton. If you're looking to sell your home in the Compton area, our listing agents can help you get the best price. Redfin is redefining real estate and the home buying process in Compton with industry-leading technology, full-service agents, and lower fees that provide a better value for Redfin buyers and sellers.

 REDFIN IS COMMITTED TO AND ABIDES BY THE FAIR HOUSING ACT AND EQUAL OPPORTUNITY ACT. READ REDFIN'S FAIR HOUSING POLICY AND THE NEW YORK STATE FAIR HOUSING NOTICE.
 United States
 Canada