Great Opportunity!! A Classic 3 bedroom 1 bathroom home ready to be updated. Single car garage with laundry hook ups. Large backyard with mature trees. Located close to shopping, restaurants and Warren High School. Sold AS IS. Trust Sale.
Welcome to this newly remodeled home in the city of Downey, offering 3 bedrooms and 2 baths. Situated near shopping centers, entertainment venues, and a host of amenities, this property provides both comfort and convenience. Step inside to discover a bright and airy interior, featuring modern finishes and thoughtful design touches throughout. The spacious living area is perfect for gatherings with family and friends, while the updated kitchen offers ample counter space and storage. Retreat to the serene master bedroom complete with an ensuite bathroom, providing a private oasis after a long day. Outside, the expansive backyard offers endless possibilities for outdoor enjoyment, from al fres
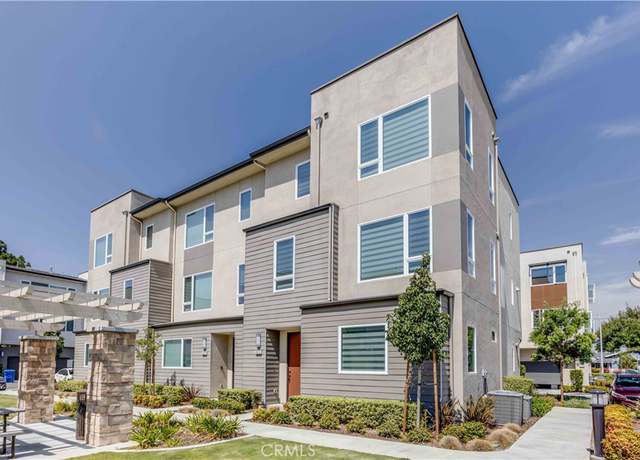
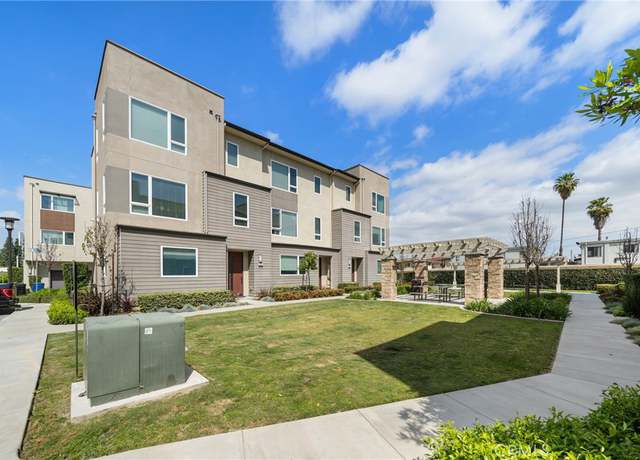
ONE OF THE BEST CORNER LOCATION IN THE COMMUNITY!!! Stunning End-Unit Townhome located at the Centerpointe complex in Downey. 4 spacious bedroom, 3.5 bathroom split level with 2 car attached garage. The lower level entrance welcomes you with a master suite with full private bathroom and walk-in closet. The Mid-level is a bright and open floor plan with high ceilings, updated airy kitchen, upgraded flooring throughout, a convenient island for cooking and dining, custom blinds, large pantry, with stainless appliances. Upstairs includes another Master bedroom with a large master bathroom featuring double vanity, walk-in shower and spacious walk-in closet. Two additional bedrooms and another fu
Charming 3 bedroom, 3 Bath Condo in North Downey with spacious living room, with fireplace, large kitchen with lots of cabinets, stove and dishwasher, kitchen eating area and direct access to 2 car garage from inside, upstairs features include primary bedroom suite with balcony, walk in closet and spacious bathroom with double sinks, shower and bath tub and vanity area. 2 bedrooms with ample closet space and a bathroom upstairs with a tub/shower combo. New laminate floors installed through out the condo, freshly painted interior. Additional private patio located just off the living room. HOA includes a sparkling pool and outdoor patio area around the pool. Conveniently located near supe
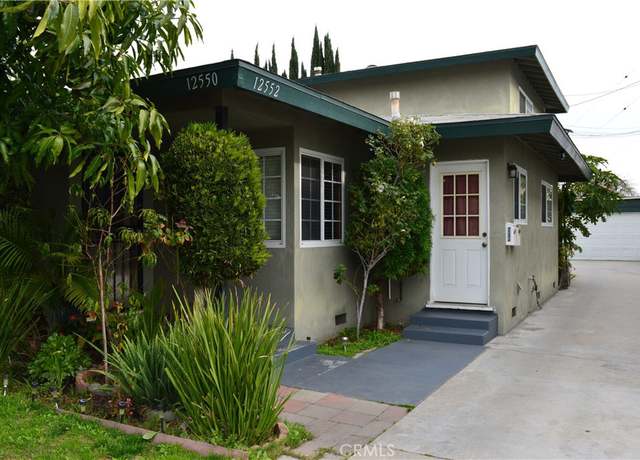
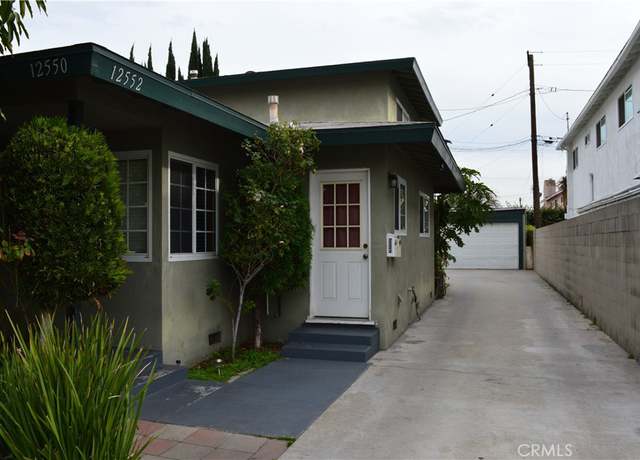
Just Listed for Sale! Amazing find! Great opportunity to own (2) on a lot, Legal (2) unit/duplex in the desirable city of Downey, CA 90242. Live in one and rent the other or rent both out. Steps away from Brookshire Children's Park and less than 1.5 Miles from "Downey Landing" which features local Cine-mark theater, fitness center, restaurants, bars, grills and a large array of stores. Great addition to any real estate portfolio or real estate schedule. 105 Fwy's are near by connecting you to 605 Fwys, 5 Fwys and 710 Fwys. Front Unit (12550) single story consists of: (2) Bedrooms (1) Bathroom, indoor laundry room, ample living room, dining room next to kitchen. Rear unit (12552) c
Rare Opportunity in Highly Desired Area of Downey! This duplex offers TWO standalone houses plus a bonus potential standalone studio-all nestled in the highly sought-after area of Downey. Immediate Occupancy: Ready to move in and make it your own! Whether you're eager to settle into your new home or start generating rental income right away, this property is available for immediate occupancy—no waiting required. Two Standalone Houses: The front house is currently configured as a 2 bed, 2 bath (with the option to convert back to a 3 bedroom prior to close), boasting approximately 1,333 square feet of living space. With amenities like an inside laundry area, new A/C unit, cozy fireplac
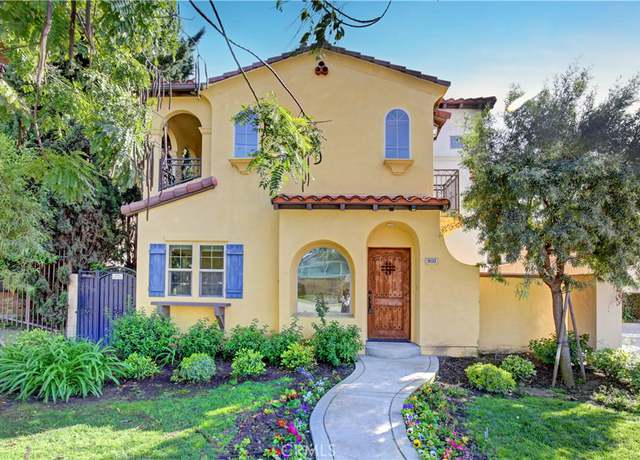
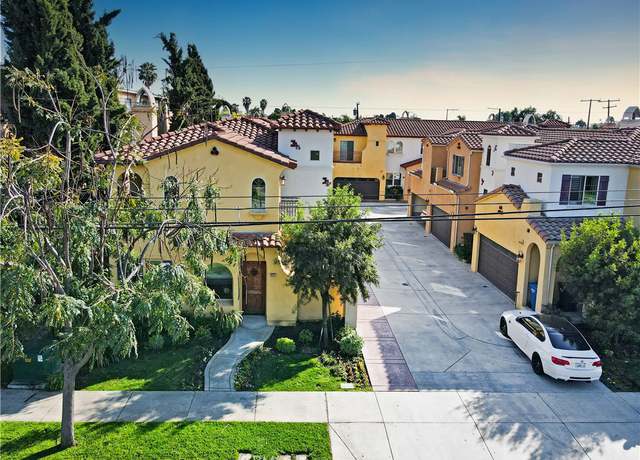
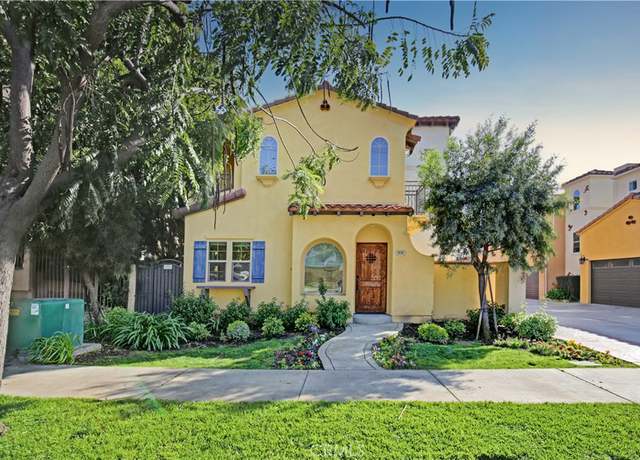
Embark on a journey of refined living in the heart of Downey, where luxury meets tranquility in this exquisite Mediterranean/Spanish style custom residence hidden in a cul-de-sac. Welcome to a realm of timeless elegance, where every detail has been meticulously curated to create an unparalleled living experience. As you step through the grand entrance, be mesmerized by the dazzling chandelier suspended from cathedral ceilings, casting a luminous glow upon the marble flooring below. Boasting four bedrooms , three full baths, and two half baths, this expansive home spans an impressive 7,977 square feet of living space, offering ample room for both relaxation and entertainment. Wood flooring g
Own Your Dream & Earn Rental Income: Two Homes, One Prime Location This unique property located off prestigious East Gallatin Rd. in North East Downey offers the best of both worlds: spacious living and potential rental income. The Main House: Brand new construction adds an additional 495 sqft, transforming this into a luxurious 3-bed, 3-bath home. Enjoy dual master suites, an extra bedroom, and a guest bathroom. The Guest House: Fully remodeled and legal, this detached 2-car garage and boasts a charming 1-bed, 1-bath unit with its own private entrance and backyard. New flooring, kitchen, paint, A/C unit, and heating create a move-in-ready space. Perfect for: * Multi-generatio
Never before on the market but renovated throughout to the new owner's delight! This 3 bedroom, 1 bath home was remodeled with new kitchen and bathroom, new vinyl plank floors, and new carpet in bedrooms. But the owner didn't stop there. .. new plumbing, new water heater, new windows, new doors, new wall furnace, new garage door with automatic opener, and freshly pruned trees and gravel front yard. The property is around the corner from both the Downey Landing & Downey Promenade, near Stonewood Mall & downtown Downey, and close to the 105 freeway. This probate listing, subject to court confirmation, is like none other!
Discover the ideal multi-generational home in the sought-after city of Downey, designed with both elegance and functionality in mind. This impressive property features a dual-wing layout, perfect for families seeking both communal living spaces and private retreats. The front wing includes three generously sized bedrooms, a stylishly remodeled bathroom, a modern kitchen, a spacious dining room, and an expansive livingroom area. The rear wing is a private sanctuary boasting an extra-large bedroom with a cozy fireplace, vaulted ceiling, an en-suite bathroom, and a kitchenette, complete with its own entrance for ultimate privacy. Flexibility is key with accessible doors that can connect or sep
Introducing this charming residence nestled in the serene Northeast Downey area, boasting 3 bedrooms, 2 bathrooms, living room, family room, and a room adjacent to the kitchen that appears to have been a patio and is now enclosed. The spacious kitchen comes complete with modern appliances, including a semi new dishwasher, microwave, and oven. This home is situated near a tranquil cul-de-sac, this home offers a peaceful retreat in a desirable residential neighborhood and HIGHLY scholastic Rated Schools, perfect for a family to raise their children. Notable features include Spanish tile flooring in the kitchen, living room, formal living room, and dining area, complemented by laminated floors
This meticulously maintained 3 bedroom/2 bathroom home in Downey has lovely curb appeal, and offers new exterior paint, a new roof, and a landscaped front yard. Step inside and you'll be greeted by the home's charming character featuring a freshly painted, sunlit living room, and architectural elements such as beautifully refinished original hardwood oak flooring, a tiled fireplace with an oversized mantel, a large picture window with golf-course views, and coffered ceilings. A distinctive archway leads to the dining area with refinished parquet flooring, and is open to the kitchen creating an inviting and practical space for both everyday living and entertaining. The hallway lead
Join us for an exclusive Open House Saturday 4/27/24, 12 to 4 pm at this beautiful two-story home in the highly desired Northeast Downey area. Upon arrival, you'll be greeted by an inviting front porch leading to a spacious great room, perfect for family entertainment. The first floor boasts a living room, dining room, one bedroom with a full bath - ideal for guests, and a separate family room featuring a cozy fireplace. The gourmet kitchen with oak cabinets, island, and ample pantry space is adjacent to the oversized family room. also, Laundry room next to the kitchen. The upper level the Primary Bedroom with a fireplace and large bath with dual sinks. and nice size two bedroom and full-si
Nestled in the heart of Downey, this stunning property offers the height of comfortable living and convenience. Renovated just a few years ago using high-quality Spanish tiles and fixtures in the bathrooms and kitchen, updated plumbing, and energy-efficient windows, hardwood floors, this home seamlessly blends modern amenities with timeless charm. Strategically located with easy access to major freeways, commuting is a breeze, while being just minutes away from Downtown Downey means you'll have endless shopping, dining, and entertainment options at your fingertips. The nearby Downey Landing Shopping Mall provides a diverse range of retail therapy, complemented by the irresistible treats at
Welcome to this very charming and original north Downey home. Nestled on a corner lot with amazing curb appeal, this single story property boasts an expansive and configurable living room with a combination gas / wood fireplace, original hardwood floors and a den area with an adjoining open kitchen that has room to accommodate a possible island. The guest bathroom has been remodeled and the roof was replaced in 2023. The heater has been relocated to the attic and a water softener has been added. The backyard features multiple citrus trees and a poured concrete patio with floodlights while the front yard attributes include a ranch style wood fence and a beautiful Jacaranda tree. Enjoy a summ
Come and discover this meticulously maintained, upgraded condo nestled in the desirable Northeast Downey neighborhood. Unlike other condos, this residence shares only one common wall, ensuring greater privacy. Step inside to find three spacious bedrooms and two and a half bathrooms, each boasting premium upgrades. The entire home is equipped with double-paned windows featuring premium zebra dual shades, providing both style and energy efficiency. Experience modern luxury with laminated flooring throughout the residence. The kitchen is a chef's dream, showcasing shaker-style cabinets, a farmer-style sink, quartz countertops, and stainless steel appliances. Entertain effortlessly in the gener
Experience unparalleled luxury and timeless sophistication in this one-of-a-kind opportunity to own a piece of paradise in North Downey. This stunning, newly-restored custom home overlooks the acclaimed Rio Hondo golf course's 11th hole and offers breathtaking views. Custom details throughout the 4-bedroom, four-bath home make it truly unique. The great room boasts soaring ceilings, distinctive wall finishes, abundant natural light, and a stunning convertible wall as the centerpiece, opening to the outdoor living and dining spaces. The gourmet kitchen is equipped with top-of-the-line stainless steel appliances, gorgeous custom cabinetry, and stone countertops that extend to the waterfall is
Welcome to this charming 3-bed, 2-bath home on a corner lot in the heart of the beautiful City of Downey. With 1,378 sq ft of living space and a 6,085 sq ft lot, this residence boasts a custom paved driveway and inviting landscaping. Inside, the open-concept living space is filled with natural light. The kitchen features sleek design and modern appliances, making it a focal point for both style and functionality. The three bedrooms, including a master suite with a private bathroom, offer comfortable living spaces. The location is a highlight, situated in the Downey High School district and within walking distance to shopping, restaurants, and Kaiser Permanente Medical Center. Commute with e
* * This property qualifies for the $7,500 Chase Homebuyer Grant. Ask for details. * * A stunning modern home. Located close to shopping and schools in the heart of Downey, this house has it all. When you enter through the gorgeous oak front door you are greeted with newer laminate floors and clean lines throughout. To the left is the family room with large windows letting in tons of natural light. Bar seating and a fire place connect it to the custom kitchen which has quartz countertops, backsplash and numerous waterfall edges. Stainless steel dishwasher, range/oven, hood and farmhouse sink are just a few features. The abundant counter top space, perfect for entertaining continues into t
Two story Home. located in desirable quiet cul-de-sac Neiborhood. 3 bedrooms 3 bathrooms. Spacious formal living room - dining room. Family room with fireplace.
Location! Location ! View! View ! Welcome to the epitome of luxury with this stunning Plan 2 residence. Nestled in the heart of Northeast Downey, Constructed in 2014, this townhome is part of a secure gated community boasting an exclusive lifestyle of comfort, sophistication, and well-appointed features. This home situated the best location in the community, Prime lot!! The spacious layout includes 4 generously-sized bedrooms plus one Den( open office) and 3.5 tastefully outfitted bathrooms, with great the first floor Bedroom feature like a very independent a convenient ground-level bedroom featuring an en-suite bathroom. 2038 Sqft. The heart of this home is a spacious family room that seam
Welcome to this stunning, remodeled single-story residence located in the highly coveted area of Northeast Downey. As you arrive, you'll be greeted by a leaded glass front door that opens to a newly tiled front porch, setting the tone for the elegance and attention to detail that defines this home. Inside, experience the warmth and welcoming atmosphere of the open floorplan, highlighted by luxurious wood tone vinyl plank flooring throughout. The chef's kitchen, a masterpiece of design, features quartz countertops with a stylish waterfall edge, custom wood cabinetry adorned with gold handles, and a center island that provides informal seating - perfect for entertaining guests or enjoying qui
Recently remodeled NE Downey pool home coming soon! This 4 bedroom, 4 bath home has been redesigned and updated with all the modern amenities. The backyard has a recently remodeled pool and spa with new artificial grass as well. SO many upgrades that you won't want to miss.
Welcome to this charming home in the desirable city of Downey. Crafted to perfection, this beautiful 4 bed and 2 bath boasts in 1,764 sqft. As you step inside, you'll be welcomed by the first spacious living room with hard wood floors. Right next to it you will find the dining area which is great for enjoying meals or spending quality time with family. Enjoy the second living room great for entertaining. The 4 spacious bedrooms create an inviting atmosphere for relaxation. Attached garage and washer and dryer hookups adding convenience to this living space. Enjoy the best of Los Angeles and don't miss the chance to own this gem! Don't miss out, mark your calendar for the open house!
Beautiful North Downey 4 Bedroom, 2.5 Bath with Pool. Home is located in a cul-de-sac. Kitchen is remodeled, featuring quartz counter tops, grey custom cabinetry with plenty of storage space. This lovely Home has a formal dinning room on an open floor plan. Living room is large with plenty of natural light. Large Master bedroom features private bathroom with dual sinks. Laundry room Conveniently located next to kitchen. Third bathroom is located close to laundry area. Property great for entertaining family and friends. Backyard has heated pool & spa. The other side of back yard comes with bar and grill connected to gas. All this under a shaded porch. Property has large driveway suita
Situated in the most sought after part of Northeast Downey, this custom built home is unmatched in class and elegance. As you arrive at the property you are greeted with beautiful landscaping uniquely and professionally designed. When you walk in the front door you are welcomed with gorgeous black granite flooring and a one of a kind chandelier. The kitchen is an absolute dream for a home chef, featuring custom cabinetry, elegant granite counter-tops, center island with an 4 burner gas range & griller built-in refrigerator, microwave, wine cooler, and warming drawer. Just off of the kitchen is the family room with a gorgeous marble fireplace and in house bar. Second floor hosts one Ma
Exceptional three-level property, a rarity with its private elevator, invites you into a world of contemporary elegance and convenience. Boasting four bedrooms and 4 bathrooms, this 2120-square-foot residence is a harmonious blend of style, comfort, and modern amenities. Ground level unfolds with a bedroom with a private full bathroom with hallway access to the elevator, washer and dryer hookups. The 2nd level welcomes you to a spacious great room, bathed in natural light, offering a seamless transition between the living, dining, and kitchen areas. The gourmet kitchen is a chef's delight, featuring Quartz Counter-tops, kitchen island, top-of-the-line appliances and sleek finishes, making
Introducing a stunning new listing: a spacious 4-bedroom, 2.5-bathroom townhome that boasts an array of modern features. Step inside to discover brand-new flooring that adds an air of elegance to every room. Enjoy the ambiance created by recessed lighting throughout the house, providing both style and functionality. One of the standout features of this property is its tankless water heater, ensuring endless hot water supply and energy efficiency. Additionally, the plumbing has been recently updated, offering peace of mind and hassle-free living. Conveniently located close to shopping centers and freeways, this home offers the perfect blend of comfort and accessibility. Whether you're commu
Immerse yourself in the refined comfort of this fully upgraded 3-bedroom, 2-bathroom single-family residence, boasting 1,600 square feet of elegantly appointed living space. Built in 1950 and thoughtfully rejuvenated, the home features a harmonious open living area floor plan that connects effortlessly with a modern kitchen, showcasing the latest appliances and finishes. New flooring and bathrooms enhance the home's luxurious feel, while large sliding doors flood the space with natural light, creating a warm and inviting atmosphere. Nestled on a good-sized lot in a quiet neighborhood, this property offers a peaceful retreat with ample outdoor space for entertainment or relaxation. Its prime
Welcome to this charming 3-bedroom, 2-bath home with a 2+1 ADU situated on an expansive corner lot next to the Rio Hondo Gulf Course. Step inside and find yourself in the heart of the home, a vast living area joined by a double door: an inviting family/dining room on one side and a spacious formal living room with a fireplace on the other. This setup offers endless possibilities for entertaining by merging these areas together or keeping them separate if you wish. The kitchen, which is just around the corner, features a breakfast nook, as well as a convenient pass-through window to the living room that ensures you're always part of the conversation. The sunroom, brimming with natural light,
Charming Completely renovated 2+1 in an adorable Neighborhood in Downey. Ann Saks tiling, quartz countertops, custom cabinetry and all new appliances are just some of the great features of this newly renovated home. Indoor outdoor living with multiple spaces for our door living. Wall of Ivy and fountain highlight your breakfast garden oasis. Inside laundry room with great storage. Full electrical and plumbing upgrade with new modern features giving the home modern features with an old world feel--new home with recessed lighting in all rooms. All new Windows and New flooring throughout the house and check out the bathroom tiling with the new Duravit tub. Conveniently located near all highwa
Don’t miss this rare opportunity!! Corner 2 story, 5 bedrooms/2 baths. Jacuzzi Spa tub, Large His/Hers walk-in closet (Master) with wall to wall closet space in all bedrooms. Cozy brick fireplace, Central Heating/Air, large 2 car garage with laundry nook, heavy duty custom shelving with a multi use/ custom use trolley system . Ceiling fans located in almost every room, including garage. 2 bedrooms on main floor and 3 bedrooms on second floor. Gorgeous stone kitchen with floor to ceiling backsplash, lots of kitchen cabinets and counter space with bay-window, including a large peninsula countertop (perfect for entertaining). Property sold As-Is. House has a great layout, making this
INCREDIBLE TOWNHOME IN PRIME N. E. DOWNEY WITH NEARLY 2,300 SQFT. OF LIVING SPACE PROVIDES THE SPACIOUSNESS OF A SINGLE FAMILY HOME - SPLIT LEVEL FLOOR PLAN WITH MAIN LEVEL INCLUDES LARGE FORMAL LIVING ROOM WITH BUILT-IN CABINET CENTER & POOL VIEW - SEPARATE FORMAL DINING ROOM W/ CHANDELIER - GALLEY STYLE KITCHEN WITH BREAKFAST NOOK & DIRECT ACCESS TO ATTACHED 2-CAR GARAGE - LOWER LEVEL INCLUDES HUGE BRIGHT FAMILY ROOM WITH FIREPLACE & WET BAR, LAUNDRY AREA, 3RD BEDROOM - UPPER 2 MASTER SUITES WITH OWN PRIVATE BATHROOM - CENTRAL A/C & HEATING, RECESSED LIGHTINGS, PLANTATION SHUTTERS - VERY WELL MAINTAINED ASSOCIATION WITH GATED ACCESS TO COMPLEX, POOL, NEW ROOF, NEW
Location, Location! * * * * * * PAID OFF SOLAR PANELS OFFERING ENERGY COST SAVINGS * * * * * Located in the heart of HIGHLY DESIRABLE NORTH DOWNEY in the Private Gated Downey Collection Community! THIS BEAUTIFUL ENERGY EFFICIENT SPACIOUS NEWER MODERN TOWNHOME IS MOVE IN READY! This gem offers 4 BEDROOMS/4 BATHS, PERFECT for a growing family! Your clients will LOVE having a FULL SIZED BEDROOM and PRIVATE BATHROOM on THE FIRST FLOOR for ideal access for elders + upper level SPACIOUS MASTER BEDROOM with PRIVATE EN-SUITE FULL BATH+ WALK IN CLOSET with easy access separate laundry closet! All rooms are of generous size and home offers plenty of storage throughout! Also featuring an OPE
Price reduced for fast sell. Welcome to this contemporary beautiful townhome is situated in a highly sought-after location renowned for its beautiful neighborhoods, Downey Centerpointe, and convenient access to various amenities and entertainment options. It boasts a generous living space of 2322 square feet, Built in 2018, featuring 4 bedrooms with 3.5 bathrooms, Corner location, a 2-car attached garage with direct access, and carpeted flooring in the bedrooms and wood flooring in Living room, Kitchen and the bathrooms. As you enter the home, you are welcomed by entry hallway, and on the first floor, you'll find a quiet and cozy bedroom with a walk-in closet and bathroom. The garage face t
Welcome home to 8610 Alameda St. Come see our New Improved Price. Very bright throughout, your family can enjoy the open concept of the living room and kitchen - adorned with Wood Tile flooring, Granite Kitchen Countertops; Stainless Steel Farmhouse Sink and Stainless Steel Fixtures. Restroom had been meticulously remodeled with a modern classy feel. Bedrooms are a great size with plenty of space. Rear Yard has plenty of room for entertaining or relaxing and a Bonus Room that could be used for crafts or extra play room, office or even a separate guest room. The oversized 2 car garage has plenty of space for 2 cars plus extra storage. Newer Roof and Water Heater. Just a short walk to the Do
Homes in this area are served by the Downey Unified School District and Los Angeles County Regional Occupational Program School District.
This area's enrollment policy is not based solely on geography. Please check the school district website for more information.
Elementary schools
Middle schools
High schools
GreatSchools Summary Rating
8/10
Price Elementary School
Public, K-5
8/10
Unsworth Elementary School
Public, K-5
8/10
Old River Elementary School
Public, 4-5
7/10
Alameda Elementary School
Public, K-5
7/10
Williams Elementary School
Public, K-3
Only showing 5 of
24 elementary schools.
School data is provided by GreatSchools, a nonprofit organization. Redfin recommends buyers and renters use GreatSchools information and ratings as a first step, and conduct their own investigation to determine their desired schools or school districts, including by contacting and visiting the schools themselves.Redfin does not endorse or guarantee this information. School service boundaries are intended to be used as a reference only; they may change and are not guaranteed to be accurate. To verify school enrollment eligibility, contact the school district directly.
Homes for sale in Downey have a median listing price of $895K. Some of these homes are Hot Homes, meaning they're likely to sell quickly.
What are some of the most popular neighborhoods in Downey?
Popular neighborhoods include Southeast La, North of Somerset, Fulton Wells, Studebaker, Downey Road, and Laguna.
How often does Redfin update their new listings?
Most of our new listings in Downey are updated every 5 minutes so you can see new homes as soon as they come on the market. Learn more
What is transportation like in Downey?
Downey, California, offers a variety of transportation options for its residents. The city experiences moderate traffic levels, making driving by car a common choice for getting around. Public transportation is also available in Downey, with bus routes providing service throughout the city. Additionally, Downey is conveniently located near several major highways and freeways, including the I-5 and I-605, providing easy access to surrounding areas. Learn more on our Downey city guide.
What types of properties are available in Downey?
Downey, California offers a variety of single-family home types, including ranch-style homes, contemporary homes, and modern homes. These homes can be found throughout the city, with many located in established neighborhoods and newer developments. Most properties feature three to five bedrooms and were built in various years. To explore different property types for sale in Downey, California, use the 'Home type' filter located above the active listings. Customize your search by selecting options like single-family homes, condos, townhomes, and more.
What is life like in Downey?
Downey, California offers a vibrant and thriving community with a variety of amenities and opportunities. The city boasts a diverse range of landscapes, from urban neighborhoods to serene parks and open spaces. The weather in Downey is typically pleasant, with mild winters and warm summers. The city provides a range of job prospects across various industries, ensuring ample employment opportunities for residents. Downey offers a plethora of recreational activities, including parks, sports facilities, and cultural events, providing residents with a wide array of options to enjoy their leisure time.
What are the schools and amenities like in Downey?
Downey, California, offers a variety of public amenities to enhance the living experience of its residents. The city boasts a plethora of restaurants, catering to a wide range of culinary tastes. Numerous parks provide spaces for relaxation and outdoor enjoyment. For your grocery needs, Downey has several stores that stock a wide variety of goods. Additionally, the city provides other amenities such as libraries, gyms, and community centers to cater to various interests and needs.
In the past month, 35 homes have been sold in Downey. In addition to houses in Downey, there were also 7 condos, 9 townhouses, and 7 multi-family units for sale in Downey last month. Downey is a moderately walkable city in Los Angeles County with a Walk Score of 61. Downey is home to approximately 112,083 people and 38,345 jobs. Find your dream home in Downey using the tools above. Use filters to narrow your search by price, square feet, beds, and baths to find homes that fit your criteria. Our top-rated real estate agents in Downey are local experts and are ready to answer your questions about properties, neighborhoods, schools, and the newest listings for sale in Downey. Our Downey real estate stats and trends will give you more information about home buying and selling trends in Downey. If you're looking to sell your home in the Downey area, our listing agents can help you get the best price. Redfin is redefining real estate and the home buying process in Downey with industry-leading technology, full-service agents, and lower fees that provide a better value for Redfin buyers and sellers.


 REDFIN IS COMMITTED TO AND ABIDES BY THE FAIR HOUSING ACT AND EQUAL OPPORTUNITY ACT. READ REDFIN'S FAIR HOUSING POLICY AND THE NEW YORK STATE FAIR HOUSING NOTICE.
 United States
 Canada