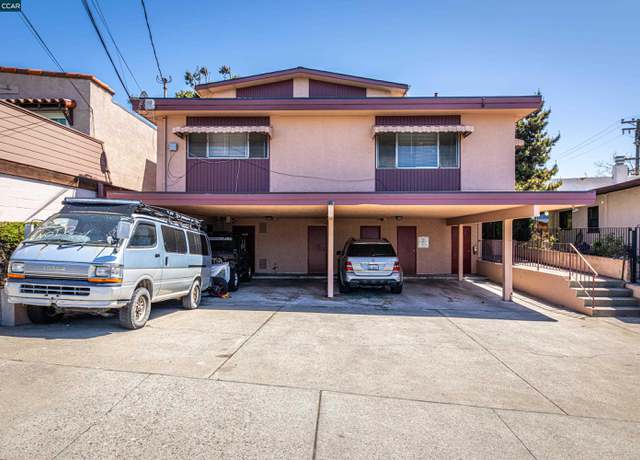
Rare Investment Opportunity in Prime Albany! Don't miss your chance to own three units in the heart of Albany! Perfect for investors or homeowners looking for additional income, this property boasts, Two spacious 2-bedroom, 1-bathroom units. One potential owner's unit with 3 bedrooms and 2 bathrooms. Carport spaces for each unit and extra storage units. Well-maintained with a brand-new roof and super spacious interiors. Seize this rare opportunity to invest in Albany's thriving real estate market! Conveniently located with easy access to transportation, Solano Ave shopping center, and schools. Plus, enjoy quick access to HWY 80, just minutes away from San Francisco!
This Breath taking bright Bay view end unit , 2-bedroom, 2-bathroom condo with updated kitchen, new flooring, paint, appliances, bathroom vanities, closet doors, is ready to welcome you home.
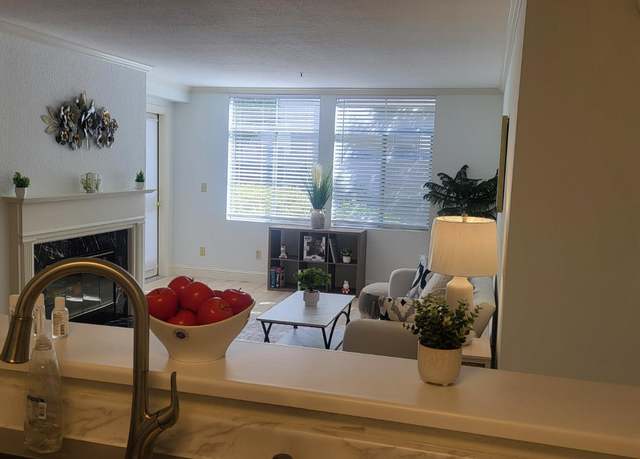
Bright with plenty of morning sun and spacious plan B. Very quite first floor former Model Unit & newly Remodeled and Ready for move-in. Primary BR w/ covered balcony, large walk in closet and en suite bath; second BR w/ wall-to-wall closets. Chef-ready kitchen boasts ample storage and counter space w/ full pantry and newer dishwasher with new oven. Recently upgraded quality Luxury Vinyl plank flooring in living room and carpeted bedrooms. Enjoy the welcoming fireplace and summer evenings on the outdoor balcony featuring dual entrances from living room and primary BR. Includes rare two covered reserved parking directly next to the elevator w/ additional spots and plenty of guest park
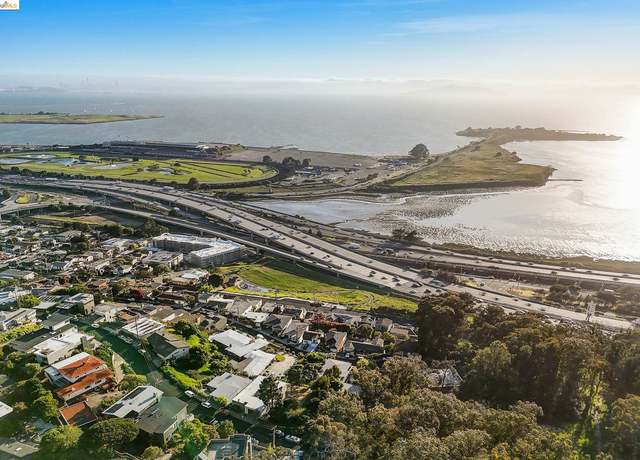
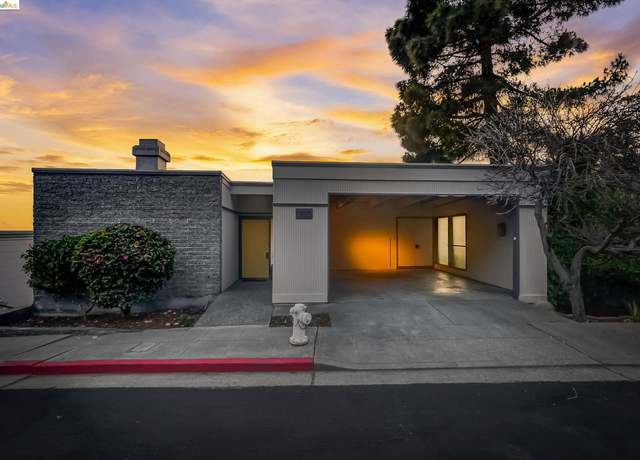
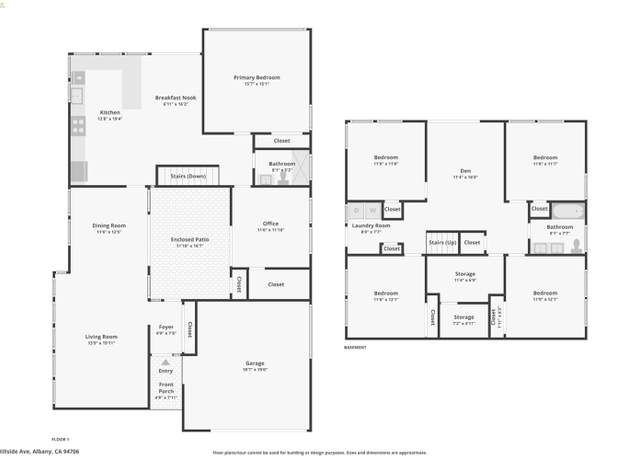
Discover a lifetime of cherished memories in this elegant contemporary sanctuary perched majestically in Albany Hills. Behold the breathtaking beauty of the San Francisco Bay, where modern luxury meets timeless sophistication. The architectural design captures the glistening Bay waters flawlessly with clean lines and expansive windows—step into a masterfully crafted interior with exposed beam timber ceilings, a tribute to mid-century design. Light dances through the open layout, accentuating the panoramic views. Entertain in the dining/living room overlooking the enchanting outdoor courtyard and the Bay. The sleek kitchen beckons with stainless steel appliances and a charming breakfas
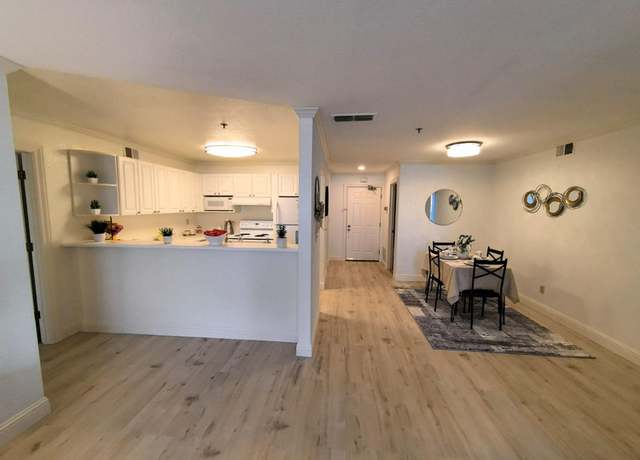
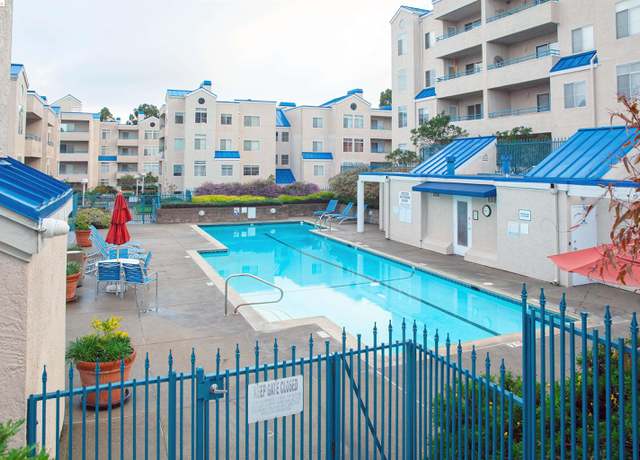
Beautifully remodeled condo in Albany at Bayside Commons. Thoroughly remodeled. new paints, new floor, new kitchen cabinets, counter top, and new appliances. washer dryer in unit. Gated community with extensive amenities including heated pool, spa, gym club house, tennis court. Easy commute to SF and Berkeley. walk to shopping mall right next. Costco, target, restaurants very nearby. top 10 Albany schools! easy to commute via Bart and freeway. This is a must see. Open house on 5/4 Saturday 2-4 pm. Off due by 5/7 1 pm if any.
Prime Albany location and uniquely spacious. Quintessential craftsman with deep covered porch, built-ins, inlaid oak floors, and tray ceilings. Clean modern updates in all the right places. The ground floor begins with a stately living room, graceful dining room and powder room. Toward the rear is an inviting kitchen and family nook, leading outdoors to a deck that functions as an extension of the kitchen. Upstairs, four ample bedrooms make up the sleeping area. The primary bedroom with remodeled bathroom and vaulted ceiling is drenched in morning light. Another bedroom large enough for two, also welcomes the morning sun, while a third offers privacy and sunsets. A fourth south-facing bedr
Welcome to your modern oasis in the heart of Albany! This stunning 2-bedroom, 2-bathroom condo boasts a sleek and contemporary design, fully renovated to meet the highest standards of luxury living. Situated on the top floor, this unit offers unparalleled views of the San Francisco Bay, presenting a million-dollar panorama that will leave you breathless. And with no noisy neighbors above, you'll enjoy peace and tranquility in your own private sanctuary. Indulge in the ultimate lifestyle with exclusive HOA amenities, including 24-hour gated security, internet, cable TV, clubhouse, swimming pool, a fully-equipped gym, and tennis courts. Unwind in the sauna or take care of laundry needs withou
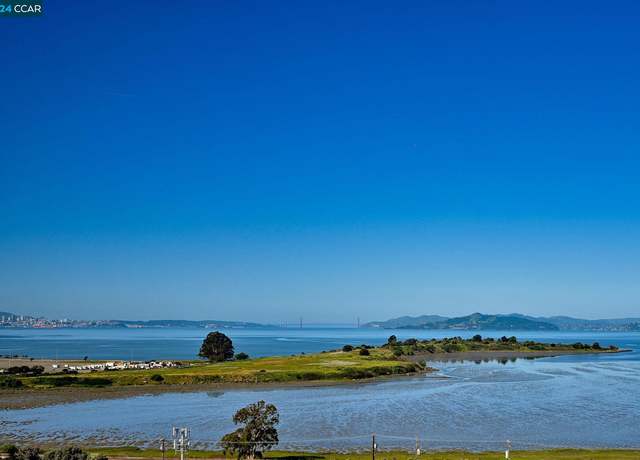
Welcome to this sophisticated 1Bed/1Bath condo with amazing bay view and golden gate view at Gateview Albany. You will feel “INSTANTLY” at home. Everything you need for a serene and stress-free life has been provided. Just bring your clothes, as all the furnishings, art, and accessories, as well as essential items for a convenient lifestyle, are included. Professionally designed by the Truly Human Living Design Group (specialists in Las Vegas luxury condos), their aim was to balance a visually striking and inspiring environment, with functionality that transforms daily life into treasured memories. Step into the spacious living and dining area of this stunning hotel-styled suite
Prime location in Albany! Surrounded by Trader Joe's, CVS, 99 Ranch and so many more shops and restaurants, with quick accesses to free way 80/580/13/24 and BART, this home is the love to commuters who enjoy fast-pace modern lifestyle. Save time for more fun!
We're pleased to present 1494 Solano Ave, a turnkey 20-unit property ideally located on one of the East Bay's most popular neighborhood thoroughfares, Solano Avenue. Originally constructed in 1958 and meticulously cared for under current ownership and management, the subject property consists of twenty (20) total units: sixteen (16) 1-bedroom/1-bathroom units and four (4) 2-bedroom/1-bathroom units with ample parking (ground floor and off-street) and coin-op laundry. The property has undergone several capital improvements including a full seismic retrofit, roof restoration, window replacements and a complete facade renovation. Recent unit upgrades include strand bamboo hardwood floors, new
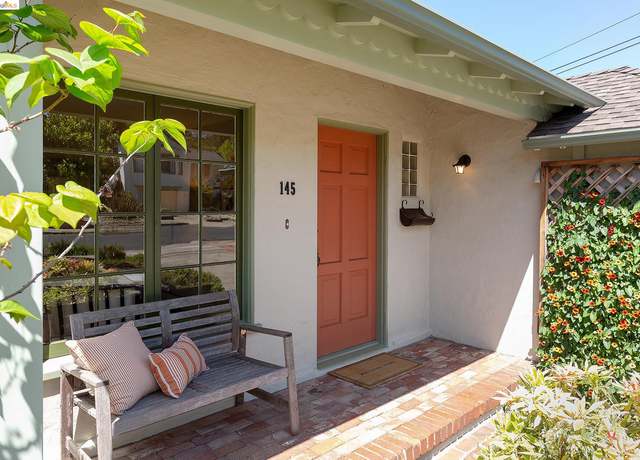
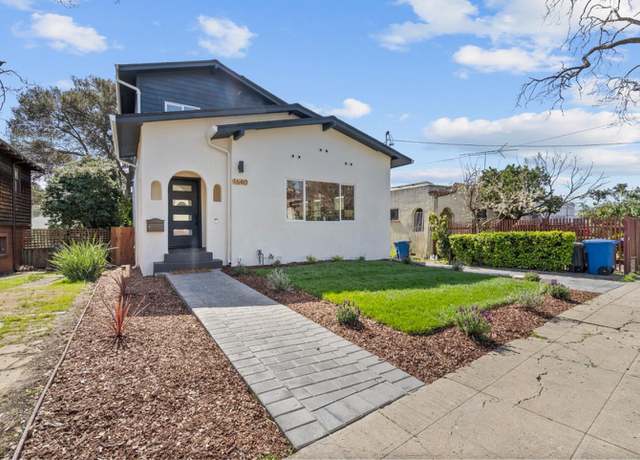
Location location location! Calling all buyers who are looking to buy in Albany and Berkeley. Come see this beautiful 2 bed 1 bath home located in the heart of Albany. This house has a large and private backyard, bonus space in the basement for a home office or workshop. The location is within walking distance to all Albany schools, restaurants, Solano Ave, Marin Ave, and Bart. The backyard is private and large enough to add an addition onto the house or ADU.
www. 1145Washington. com; Showing: Sunday 4/21 from 11am-12:30pm; Eight Large 2bd/1bth Units with Rental Upside; 100% Occupied with Stable and Paying Tenants with No Delinquencies or Deferred Maintenance; Building Amenities Include: 1:1 Gated Underground Parking Garage Ratio, Private Balconies, and Laundry; Many Units Have Been Upgraded with New Appliances, Flooring, Cabinets, Paint, etc; Conveniently Positioned in the Heart of Albany, Just Blocks from Dining, Shopping, and Commute Options; Email Agent on Website For Complete Marketing Package
"Bay View property and Investment Opportunity: Property with Tenants in Place": 2 Bed/2 Bath Condo with Pool Views and Modern Interiors - Secure Rental Income at with Tenants till Jan 2025. With established tenants already in place, generating a reliable monthly income of $3.4K /month, this property represents a secure investment opportunity in the thriving real estate market. Whether you're seeking passive income or long-term capital appreciation, this turnkey property offers the perfect balance of luxury living and financial stability. Seize the opportunity to own a piece of coastal paradise while securing your financial future. Schedule a viewing and unlock the potential of
2BR2BA corner unit has fabulous "top of the world" view of the bay, El Cerrito north and the hillside! Aprox. 1040 sq. ft. of living space + spacious balcony. The den has been converted to a bedroom. One car deeded parking, storage locker to be assigned. Current HOA fee $889 per month includes COMCAST Cable TV/Internet, water, garbage, 24 hour security, outdoor pool/tennis, indoor jacuzzi & gym. Enjoy Pacific East Mall & Pierce St. Park nearby, Solano Ave. shops/restaurants, access to Bay Trail via Central Ave. Easy freeway access and El Cerrito BART not far. Highly acclaimed Albany School District. Seller will CONSIDER paying 6 months of Buyer's HOA fees.
NEWLY UPDATED! REDUCED PRICE! Peaceful and rare CORNER, TOP FLOOR unit with wood-burning fireplace. New luxury vinyl plank floors. Fabulous view of North Bay. The building is nicely set back from HWY 580 and ideally located to avoid harsh afternoon sun while still offering expansive views. Amenities include resort-like heated pool, spa, tennis court, gym, and 24-hour security. HOA includes Xfinity cable, internet, water, and garbage. Highly rated Albany schools. Pacific East Mall and Solano Avenue shops and good eats are nearby. El Cerrito Plaza BART station is just a quick roll or stroll away! One gated garage parking space included.
PRICE REDUCED DRASTICALLY!!!Gorgeous panoramic Bay View through out East to North sights and Albany Hill views. The unit is in the corner and only 4 units on this 14th floor. It is like a semi private floor. HOA fees includes, cable tv, internet, 24 hours security guard on duty, heated swimming pool. jucuzy, gym, tennis courts, drive through parking and much more. Walking distance to BART, shopping mall, Ranch 99 market and Solano Ave. AC bus to SF is stop at front of the building. One of the best school in Albany from elementary to high school. Free way access in 5 minutes.
Located in an especially sought-after part of El Cerrito, this warm and welcoming St Jerome’s home has been meticulously maintained. The cozy living room has a beautiful brick fireplace and opens onto the dining room. The spacious kitchen has a generously-sized pantry and interior access to the garage. The showcase bathroom has elegant tile, ample storage, and a skylight. This single level home has excellent separation between public and private spaces, allowing easy living. The two sunny bedrooms have beautiful garden views, and the primary bedroom has a large closet. The second bedroom has a sliding door with access to the large entertainment deck. The private, rear garden has been
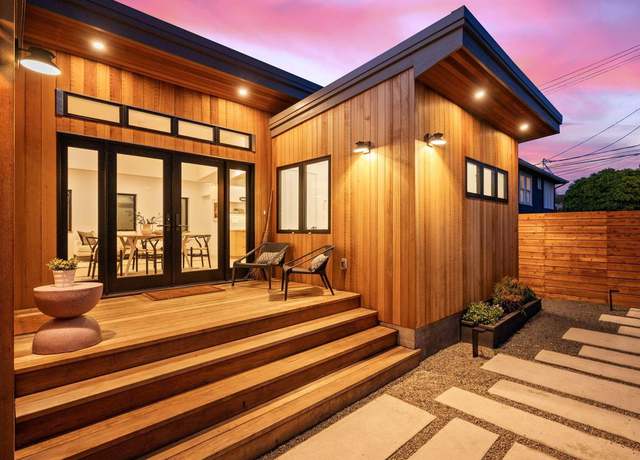
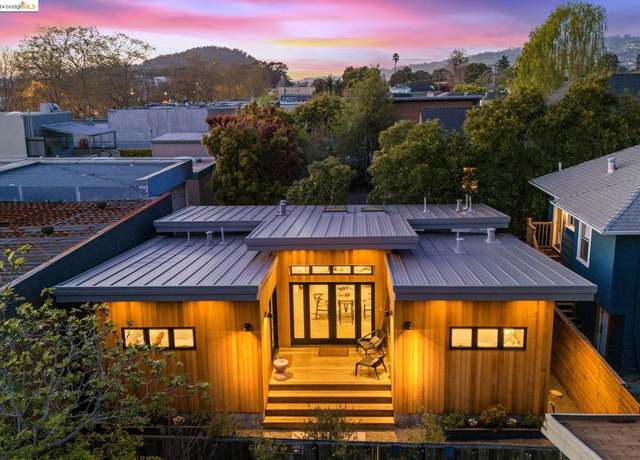
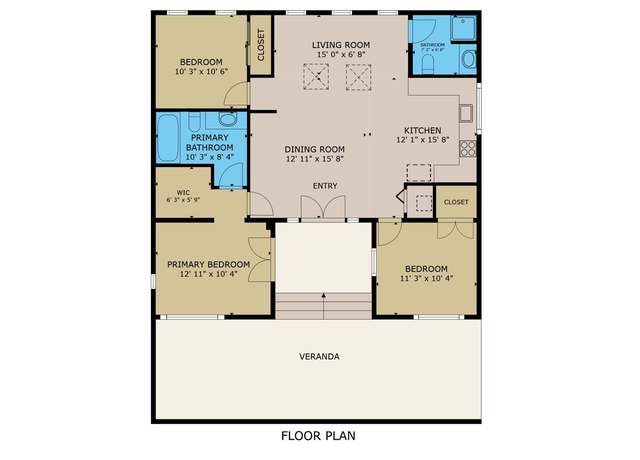
Eco-friendly net-zero, new construction in the heart of Westbrae!. Bespoke finishes & master craftsmanship are found in this open-concept layout. Exterior straight grain cedar walls, metal roof, cedar clad overhangs w/ inset lighting, Marvin windows & doors, living room skylights, designer kitchen offering floating shelves stone counters, custom tile wall backsplash, & all-electric appliances with/induction range cooktop. 3 bedrooms, luxurious primary suite w/ shower & soaking tub. Hall bath offering a sleek, frameless glass shower, floating vanity, & modern designer tile. Electric mini-split HVAC system offering both heat & AC. Tranquil gardens include a p
Gorgeous masterpiece newly rebuilt, upgraded, and redesigned from top to bottom featuring 5 Beds 4 baths, and an immaculate chef's kitchen with stainless steel appliances. Amazing attention to detail, an entertainer's dream home, perfectly distributed layout it let all the good energy flow throughout this home. Street level offers a private office and a jr. en-suite perfect for guests or when the in-laws are in town. Located in the beautiful Colusa Circle neighborhood within walking distance from all the shops. Meticulously manicured backyard feels like your own personal & private nature retreat, look no further and visit this beauty
Amazing location on appealing, popular Yosemite Road. This 1925 classic is in a natural setting surrounded by a grove of native oaks in the aptly named Thousand Oaks neighborhood. This is a home with space and light. The spacious living room is light-filled all day long through windows on three sides, which also create views into the treetops. Across the large entry hall, through French doors, is a gracious dining room. Gleaming hardwood floors recently refinished and other original details add character to these rooms. The updated kitchen is next to the dining room and also opens to a second living space. An informal breakfast area has views to the deck and the trees beyond. Upstairs are
This area's enrollment policy is not based solely on geography. Please check the school district website for more information.
Elementary schools
Middle schools
High schools
GreatSchools Summary Rating
8/10
Marin Elementary School
Public, K-5
8/10
Cornell Elementary School
Public, K-5
7/10
Ocean View Elementary School
Public, K-5
School data is provided by GreatSchools, a nonprofit organization. Redfin recommends buyers and renters use GreatSchools information and ratings as a first step, and conduct their own investigation to determine their desired schools or school districts, including by contacting and visiting the schools themselves.Redfin does not endorse or guarantee this information. School service boundaries are intended to be used as a reference only; they may change and are not guaranteed to be accurate. To verify school enrollment eligibility, contact the school district directly.
Homes for sale in Albany have a median listing price of $655K. Some of these homes are Hot Homes, meaning they're likely to sell quickly.
What are some of the most popular neighborhoods in Albany?
Popular neighborhoods include West Albany, Plaza, Southwest Richmond Annex, Richmond Annex, Oceanage Condominium, West Berkeley, Ocean View, Westbrae, and University Village.
How often does Redfin update their new listings?
Most of our new listings in Albany are updated every 5 minutes so you can see new homes as soon as they come on the market. Learn more
What is transportation like in Albany?
Albany, California is well-connected with a variety of transportation options, including public transit. The city's traffic levels can be moderate to heavy, especially during peak commuting hours, making driving a car a bit challenging. Public transportation is available, with AC Transit providing bus services throughout the city and to neighboring areas. Albany is also conveniently located near several major highways and freeways, including Interstate 80 and 580, providing easy access for car travel. Learn more on our Albany city guide.
What types of properties are available in Albany?
Albany, California offers a variety of single-family home types, including ranch-style, contemporary, and modern designs, with most properties featuring three to four bedrooms and built within the last 20 years. These homes can be found throughout Albany, California, in neighborhoods such as Ocean View, Albany Hill, and Albany Village. To explore different property types for sale in Albany, California, use the 'Home type' filter located above the active listings. Customize your search by selecting options like single-family homes, condos, townhomes, and more.
What is life like in Albany?
Albany, California offers a unique living experience with its charming community and vibrant atmosphere. The city is surrounded by beautiful natural landscapes, including rolling hills and stunning views of the San Francisco Bay. The weather in Albany is characterized by mild temperatures throughout the year, providing residents with pleasant and comfortable living conditions. The city also provides a range of job opportunities, with a diverse and thriving local economy. Residents can enjoy a variety of recreational activities, such as exploring numerous parks, engaging in outdoor sports, and participating in community events.
What are the schools and amenities like in Albany?
Albany, California is home to a variety of public amenities that cater to the diverse needs of its residents. The city boasts a multitude of restaurants, offering a wide range of cuisines to satisfy all palates. For those who enjoy the outdoors, there are numerous parks scattered throughout the city, providing ample space for relaxation and recreation. Grocery shopping is convenient with several grocery stores located within the city limits. Additionally, Albany offers more amenities such as libraries, fitness centers, and a community center, ensuring a high quality of life for all its residents.
In the past month, 12 homes have been sold in Albany. In addition to houses in Albany, there were also 13 condos, 1 townhouse, and 1 multi-family unit for sale in Albany last month. Albany is a fairly walkable city in Alameda County with a Walk Score of 84. Albany is home to approximately 18,097 people and 3,917 jobs. Find your dream home in Albany using the tools above. Use filters to narrow your search by price, square feet, beds, and baths to find homes that fit your criteria. Our top-rated real estate agents in Albany are local experts and are ready to answer your questions about properties, neighborhoods, schools, and the newest listings for sale in Albany. Our Albany real estate stats and trends will give you more information about home buying and selling trends in Albany. If you're looking to sell your home in the Albany area, our listing agents can help you get the best price. Redfin is redefining real estate and the home buying process in Albany with industry-leading technology, full-service agents, and lower fees that provide a better value for Redfin buyers and sellers.


 REDFIN IS COMMITTED TO AND ABIDES BY THE FAIR HOUSING ACT AND EQUAL OPPORTUNITY ACT. READ REDFIN'S FAIR HOUSING POLICY AND THE NEW YORK STATE FAIR HOUSING NOTICE.
 United States
 Canada