Rare Kensington fixer! Sweeping, mesmerizing views: San Francisco, Golden Gate, and Bay views!. A fixer with a large, sunny lot that needs your vision! Mt. Tamalpias, the Islands, and Bridges complete the picture! 2-car garage.
Nestled amidst serene landscapes, yet close to the Claremont Hotel, Rockridge and Elmwood shopping districts, this contemporary masterpiece offers the epitome of modern living fused with the tranquility of nature. This spacious retreat with a park-like yard has five bedrooms and three baths, as well as an ADU on the lower level with its own bath. Berkeley address with Oakland Services. Large windows and multiple skylights invite sunshine into each room and corner of the home. Verdant views from every window envelope the beauty of the surrounding landscape. The babbling brook below offers a soothing backdrop to daily life. The open upper-level floor plan is ideal for entertaining with the ki
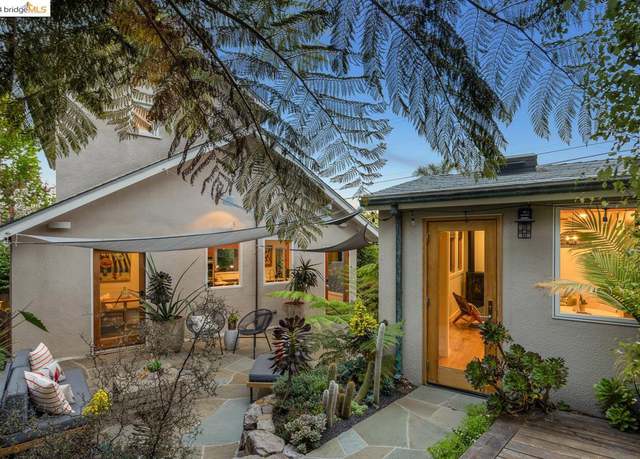
This is it! Nestled in the heart of North Berkeley, 1521 McGee provides the perfect blend of sophistication and functionality. The main house features 3 bedrooms and 2 full bathrooms, while the versatile detached garden studio is perfect for multi-generational living, a home office, or guest quarters. Step outside to a park-like backyard oasis with mature landscaping that wraps around the home. You’ll enjoy privacy and seclusion with ample space to entertain on the patio, soak in the hot tub, or just savor the tranquil environment surrounded by beautiful Japanese maple trees and lush greenery. The sunlit interior features soaring ceilings, hardwood floors, skylights throughout, and an
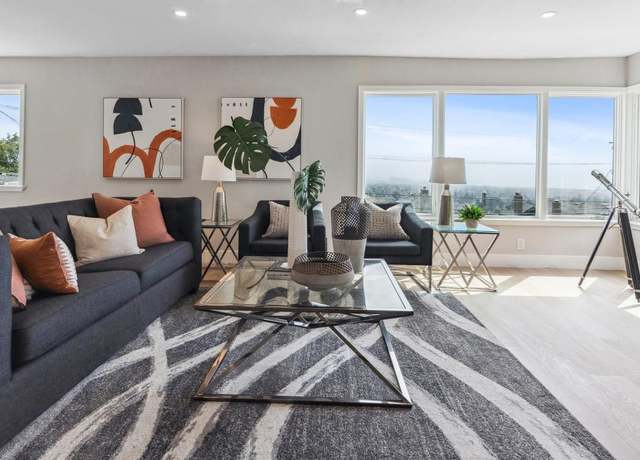
Phenomenal Bay and SF City views from this spacious, renovated Berkeley home! New modern kitchen and bathrooms, 7 bedrooms (staged as 6 bedrooms plus office), 4 bathrooms, family room, attached garage and tons of storage. Beautiful light, great flow, many upgrades including a chef's kitchen, engineered hardwood floors, recessed LED lighting, dual pane windows, and tiled bathrooms. Unobstructed panoramic views from the large deck, plus massive views from the living and dining rooms, this home is the perfect place to relax and entertain while being close to the heart of Berkeley. Open Sat/Sun 4/27 & 28 from 2-4:30.
1215 Alvarado Rd, is the last home built by the renowned Berkeley Hills builder, Hopkins/Palmer & Associates. This is a custom home with craftsman touches, has soft colors & high quality finishes. 5 BDs plus den, family & media room. Possible in-law set-up. Expansive Claremont Canyon views. Living room balcony some bay views. Primary suite has a fireplace, attached workout room/large walk in closet. Bathroom has a large soaking tub with jets and a large separate shower. Home has ample storage, privacy and elegance with a central location.
2744 Belrose Ave. is a most wonderful 1950 John Ballantine designed mid-century home on a 13,0000+ sq. ft level, southwest facing lot. With wonderful spaces, almost every room opens to the garden & lots of sunlight. The architecture is distinctive, high ceilings, large windows opening to the garden & did I mention Pool? Surrounding brick terrace welcomes lounging and the pool captures one’s attention. The rear garden is enclosed by stucco and brick walls. Entry hall leads to the gorgeous living room, French doors to the garden, dining room w/ doors & windows facing south, breakfast room & kitchen. There is a large en-suite bedroom as well as laundry room + smal
A true hidden gem, 1301 Rose Street surprises with its vintage charm and modern renovations. Newly refinished hardwood floors, fresh paint and modern light fixtures create a welcoming environment when you first walk through the door. The large, original fireplace creates a gorgeous centerpiece for the formal living room. The lovely dining room has large windows and features chair rails and wainscoting. The brand new eat-in kitchen showcases new stainless steel appliances, Caesar stone countertops and modern cabinetry. The spacious sunny bedrooms offer a wall of windows and oversized closets. Ample attic space can be used as a studio or for additional storage. The renovated bathroom showcase
This charming & practical single-level triplex is in the sought-after Westbrea neighborhood of West Berkeley, less than 1mi to the famed Monterey Market. Cedar Rose Park, 1blk away is accessed by the SF Bay Trail. Each unit is a spacious 2bd/1ba with an in-unit W & D, dedicated garage/storage area, and is separately metered. There is additional off-street parking on Peralta Ave. One unit will be delivered vacant for live-in owner(s), additional rental (student housing), personal offices & /or art studio spaces. BikeScore of 99, & WalkScore of 88, due to its proximity to local favorites like the vibrant restaurants & shops on 4th Street & Solano Avenue, UC Be
Sited to take advantage of the panoramic Bay, Bridge and San Francisco views, this updated Berkeley Hills Mid-Century features level-in entry, tucked away behind a lush front yard. Great indoor/outdoor flow and breathtaking vistas from many of the windows and the stunning over-sized deck, perfect for entertaining, lounging and al fresco dining. The newly updated kitchen with sleek finishes and new appliances opens to the bright dining room with its own view balcony on one side, and a private patio surrounded by gardens on the other. 2 bedrooms and a sunroom share a hall bath on the main level, downstairs, a spacious family room/lounge space is joined by 2 other bedrooms and a bath, as well
Open the carved wooden gate at 1227 Channing, step inside and you will be immediately drawn in by the wonderful front porch and lovely front yard. Character, warmth and light, and a seamless indoor-outdoor are some of the many qualities of this wonderful home. A thoughtful floor plan, perfectly balancing public and private space, a delightful backyard, with the sweetest playhouse, bountiful, thornless blackberry and blueberry bushes, numerous fruit trees (apple, fig and loquat) a lawn, a patio, and a deck, and the ideal location, proximate to a public pool, Strawberry Creek Park, shopping and a host of cafes and restaurants, further enhance this special home. The owners, J and D, shared how
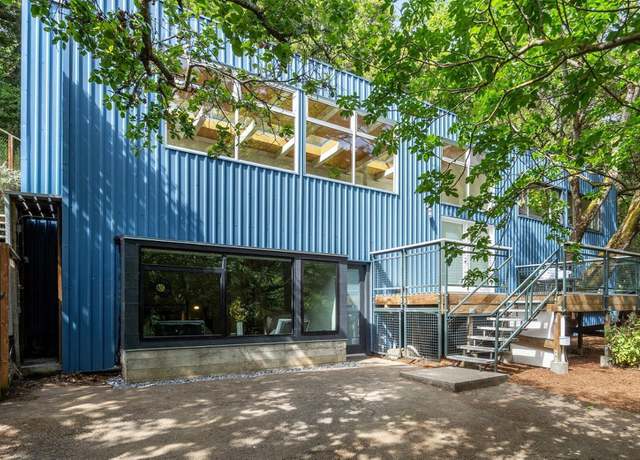
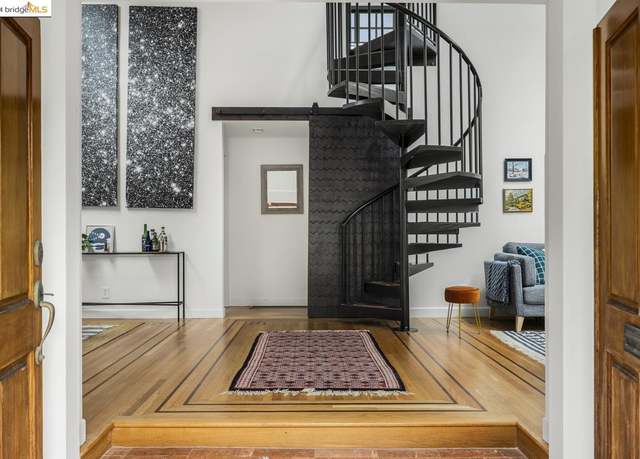
Iconic Architecture! Vanguard building concept by an owner-artist-musician & composer – but alas, never fully realized – it soars in the Berkeley Hills. Very substantial and solid in its current steel structure, .. .possibility of repurposing what is a very dynamic voluminous open-concept area (space and light) into a modern living area for todays life style. The lower level has higher cieling (+9 feet) bottom level w bath plumbed -extensive outdoor deck allow you to create your private life among interior and exterior art & beauty. Former owner speaks for himself. .. https://vimeo.com/486476752 -2 parcels, for potential value-added, giving the structure-parcel-buyer
Reinvented from the ground floor up, no detail has been overlooked in this exceptional renovation that offers a beautiful main house with a coveted open floor plan, stunning kitchen, 4 bedrooms up, 2.5 baths, home office, Accordion doors, and a legal ADU featuring an additional bedroom and bath. A landscaped garden offers separation between the two units, and ample room to entertain. With a Walkscore of 82, this chic property sits in the heart of Berkeley, close to coffee, restaurants, and public transit. Don’t miss this fantastic opportunity to own and rent in an eclectic and vibrant community.
Nestled in the heart of Berkeley, this charming 1920s bungalow merges timeless elegance w/ modern amenities. Situated on an amazing lot, this property offers 2bed/1ba, living room, formal dining, kitchen, laundry, storage room in basement, a large driveway for multiple parking & security gate. Upon entering, you'll be greeted by a formal entryway, large living room w/ abundant natural light. Beautiful hardwood flooring. Remodeled kitchen & bathroom. The rear bedroom, elevated by the split-level design, offers tranquil garden views & a unique charm. Below, a partial basement provides additional storage space. Step outside to the sunny spacious backyard, perfect for entertai
Stylish Craftsman with modern upgrades and vintage essence in the heart of Berkeley. A gorgeous single-level home, with a detached garden studio, offers a serene retreat in the hub of a vibrant neighborhood. Minutes to the world-renowned UCB, fabulous restaurants, performing arts theaters, music venues & nearby N Berkeley BART. Beyond the gate, an oasis awaits, where professionally designed gardens create private & peaceful surroundings. The covered porch, with its graceful arches, beautifully frames the garden. Once inside, a roomy foyer leads to a well-lit living room with wall-to-wall picture window, brick-faced fireplace, and built-in bookshelves. The open-concept dining roo
Sits above Cal Berkeley’s International House and just steps away from Memorial Stadium, this top-floor gem offers a unique blend of tranquil charm and urban convenience. Step into a bright floor plan that maximizes living space, highlighted by large closets for ample storage, in-unit washer and dryer, and sliders in the primary bedroom lead to its own private balcony. The spacious balcony off the living room connects indoor living into the outdoors, offering a peaceful setting for relaxing or entertaining. Additional features includes elevator access and secure parking. With a backdrop of beautiful trees, it will feel like your own private escape without sacrificing access to the cit
Experience the perfect blend of charm and convenience in this beautifully updated 1-bedroom, 1-bathroom condo, ideally located near UC Berkeley’s Northside and the vibrant Gourmet Ghetto. This inviting home is perfect for anyone desiring a dynamic urban lifestyle. Inside, you’ll find a tastefully renovated interior featuring gleaming hardwood floors, adding warmth and elegance to the space. The updated bathroom boasts modern fixtures and a fresh, clean design, ensuring your comfort and convenience. The kitchen is a functional space perfect for casual dining. Large windows not only enhance the layout's openness but also offer peek-a-boo views that add a unique charm to this cozy
Perched atop the Berkeley Hills, this Mediterranean-style gem merges architectural elegance with contemporary comfort, offering stunning San Francisco Bay views. The recently reimagined front yard offers your first glimpse of the sophistication and warmth of this home. This property boasts 5 bedrooms, 3 bathrooms, generously spaced out in the 3588 sq ft of living space which includes a primary suite with a wine bar in the sunroom for enjoying panoramic vistas. Central to its charm is a remodeled gourmet kitchen featuring a La Cornue handcrafted French range. Other highlights include gleaming hardwood floors, a formal living room with open beam ceilings & fireplace, an adjacent dining
Urban oasis with a magical garden in the heart of South Berkeley and the border of Elmwood. This home has old-world sophisticated charm with wood floors, grooved plate sills, box beam ceilings, dining pocket doors, kitchen swing door, and picture hanging molding all with original hardware. In addition to the charm, there are many updates: A well-appointed kitchen, with French doors to the yard, updated counters and cabinets with ample storage, and high-end appliances. The bedrooms are large and light filled. The bathroom is also updated, as well as most of the windows in the house. The large secluded garden boasts country life ideas: A chicken pen is ready for you, a lovely redwood tree tea
Rare 1930s Berkeley Hills Craftsman Retreat on a lush 7,000+ Sq Ft Oasis with incredible landscaping and stunning two-bridge views! This Fredrick Reimers designed home, greets visitors with a Grand Gated Entrance and private garage that leads up to a large and level brick patio/BBQ area ready for greeting guests, entertaining & play. Once inside, this Craftsman stunner boasts a Great Room finished in warm Clear Heart Redwood, open-beamed ceilings, a hardy stone FP and big windows w/ direct views to the Bay & beyond! A galley kitchen, which includes a private View Deck nearby, makes this home an entertainer's dream. Tucked quietly in the home's North wing are 2 ample BDs includi
Lovingly designed and created, this 2018 total renovated 2 bed/1 bath home is one of Berkeley's most desired neighborhoods. Features include an open concept living/kitchen/dining room, heated faux-wood tile floors, solar power, and a beautiful gas fireplace! The kitchen will be a delight to cook in - stainless steel appliances, built-in microwave and oven, and ample storage - any chef will be inspired. Tile flooring, dual pane Marvin aluminum clad windows, security camera system by Hikvision
Bring this North Berkeley Hills fairytale back to life in this contractor’s special! With a lovely layout accentuating Golden Gate views and some old world charm worthy of preserving, this 3+BD/2BA storybook home is ready for TLC and a modern vision. Step through the stone-arched front door into the 1784 SQFT home with original redwood intact. The living room features stunning views from the Golden Gate Bridge to Mt Tam. Both the fireplace mantle and crown molding retain the home’s vintage woodwork. A sunny dining room with mullioned windows and a built-in bench, shelving, and storage adjoins the kitchen with a bonus room, offering the opportunity to develop a dream custom kitch
Unleash your inner designer and transform 936 Camelia St in North Berkeley! This diamond in the rough boasts a spacious yard with the potential to add an ADU, creating a rental unit and maximizing your investment. A complete remodel is needed with endless possibilities. Envision a modern masterpiece tailored to your desires. Don't miss out on this exceptional opportunity to craft your dream home and build wealth through a potential rental unit. Contact us today to schedule a viewing!
This fantastic home has been thoughtfully transformed by a local master builder, and now offers an outstanding floorplan & indoor-outdoor living, along with a fabulous location close to parks, Chez Panisse, & countless other Gourmet Ghetto or Solano Ave amenities. Whether you're entertaining a large group, relaxing on the weekend, or spending a routine weeknight at home, the moments & the memories will be enhanced by this delightful North Berkeley residence. The main level features a chef-worthy kitchen open to the dining and living areas, as well as a separate large family room and a powder room. Upstairs are 4 bedrooms & 2 full bathrooms, including a dreamy primary
Contemporary 4 bedrooms, 2 bath home with incredible views. As you enter, there is a large living room that leads to formal dining room with panoramic views. Lots of natural lights with open floor plan. The house includes spacious three bedrooms upstairs and downstairs master/guest room. Freshly painted and move in ready. The rear lot provides plenty of space for gardening and family gatherings. This home has new built decks and patios. Own private access to park and basketball court. Easy access to Berkeley Rose Garden, Tilden Regional Park as well as UC Berkeley and the BART station. This house is a truly rare find in one of Berkeley's most beautiful neighborhoods.
Northbrae in the Berkeley foothills is the desirable backdrop for this large and well maintained 2-storey craftsman view home from 1915. A deep, covered porch sets the tone for the grand interior that awaits you through a stately front door. At ground level is a wide, updated kitchen, formal dining room, pantry, and large family room. The home is updated for modern living yet retains its old world charm with wainscotting, crown molding, coffered ceiling, built-in cabinetry, & hardwood floors. At the top of the wide staircase you’ll find 4 roomy bedrooms, 2 of them with views of San Francisco and the Bay Bridge. Flexible living spaces include a covered upstairs balcony and a multi
Level-in, energy-efficient 3BR, 2BA Kensington home with thoughtful upgrades from foundation to roof. Designed by renowned mid-century architect Paul Hammarberg, the home is an amazing combination of classic architecture and modern interiors. Light-filled living room anchored by a central fireplace with gleaming hardwood floors connects seamlessly with the open plan eat-in kitchen with custom cabinetry, built-in appliances, quartz counters and adjacent dining area. Rear family room features a cozy window seat, west-facing balcony, laundry room and door to back yard. Main level also includes: primary bedroom with adjacent bathroom and spacious hall closet; and two additional bedrooms, one wi
You’ve found your dream home in Berkeley's vibrant Westbrae neighborhood! This charming two bedroom + one bathroom bungalow has been lovingly maintained by the same family for almost 45 years. Step inside to discover a spacious and inviting living area adorned with gleaming hardwood floors, formal dining room, and a large eat-in kitchen plus a convenient laundry room. But that's not all! A large deck leads to a spacious backyard and storage shed. Need extra space for work or play? The garage turned flex space, complete with a skylight, offers endless possibilities—a home office, yoga studio, or creative retreat—the choice is yours! Parking? No problem! A long driveway prov
This inviting Berkeley home offers spacious, bright rooms, many thoughtful updates, and fabulous location close to UC, Live Oak Park, & all the best Gourmet Ghetto amenities! Main level features a lovely connection between living room, dining room & open kitchen – along with an office/bonus room & full bathroom. Upstairs are 4 bedrooms & a second full bathroom, with potential for joining two of the bedrooms to create a large primary suite if desired. The backyard beckons with a large deck & new plantings along with drip irrigation. A detached garage has been converted by a prior owner as a flexible room for office, play, hobbies, exercise, etc. Foundation
Mid-century sanctuary, where timeless elegance meets modern organic sustainability. Beautiful original architectural details with tasteful improvements. Rich wood interior finishes create a serene natural aesthetic. Sited on a lush rustic deep garden. Expansive decks look out to the gorgeous view, enjoy sipping champagne in your spa and looking out to nature and the view. Located in a very pretty neighborhood in Kensington mid way between Village shops and Colusa Circle. It feels like Marin in Kensington. 30 min. to S. F. & Marin. Blocks to charming shops and dining, beloved parks and public transportation. Kensington Hilltop school zone. This is a feel good home, where upon entering
This charming spacious 1 bed, 1 bath condo near UC Berkeley campus on the north side of Berkeley. Spacious living room, hardwood floors, dining room/office, kitchen with eating counter, large bedroom with mirrored closet, bathroom with heated lamps. Indoor parking and storage. Building has elevator. TLC needed to make it your dream home. Close to shops, restaurants, and cafes. Don't miss out!
ARCHITECTURAL PEDIGREE, ELEGANT MID-CENTURY designed by Gerald McCue. CLASSIC, TASTEFUL and SOPHISTICATED. This home features many of the architectural details he is known for; rich redwood paneling, floor-to-ceiling windows, elegant open living spaces and clean lines which draw you to the outdoors. The bedrooms are generously portioned, 2 room primary suite with office or media room. The private back courtyard, with excellent indoor-outdoor flow is the perfect place for hosting a cocktail party or enjoying a peaceful morning with the Times. Behind the two-car garage is a spacious WORKSHOP or additional storage. Garage has 220 for your EV. Located just off Grizzly Peak with easy access to T
Architecturally distinguished Claremont Court home by Henry H. Gutterson, blt 1915. 2922 was the first of Gutterson’s many homes and designed for himself and his wife. The design incorporates his love of gardens and desire to make the garden spaces accessible and integrated with the home. He succeeded! All the public rooms open to patios and a large stone terrace with walled seating. Private, lush, and south facing. The main living has a very distinctive gracious living room… interesting windows, 2 doors opening to small decks, a gorgeous stone fireplace and bookshelves at one end. The dining room opens by sliding door to the patio. A great Glenn Jarvis kitchen, part of an expa
Welcome to 1082 Keith Ave, Berkeley, a cozy retreat nestled in the heart of the Berkeley Hills, where care and thoughtful updates await. Step inside and bask in the light-filled, open layout that seamlessly blends modern elegance with timeless charm. The kitchen is a culinary haven, boasting sleek countertops, ample storage, and lots of space, perfect for every home chef's needs. Picture yourself preparing meals while overlooking your backyard oasis, with hints of San Francisco in the distance. Off the dining area, a stylish deck invites you to unwind amidst peaceful views of the surrounding Berkeley Hills—a serene setting for al fresco dining or your morning coffee ritual. Just a sho
Nestled on a cul-de-sac on a quiet street, this picturesque 1890 farmhouse style Brown Shingle exudes the charm & warmth of a bygone era. Soaring ceilings and tall windows characterize the light filled living/dining rm with central fireplace – a perfect backdrop for entertaining and family gatherings. Spacious eat-in kitchen w original open shelving, overlooks garden & opens to expansive deck for al-fresco dining. 2+ brms on the entry level share Jack & Jill bath. Upstairs, two additional brm suites offer options for flex spaces such as family room or office space. Large balcony for quiet relaxing. Basement level contains laundry area & addl cozy bonus space. L
Discover the perfect opportunity with this 862 square foot, two-story light industrial/commercial space located in the heart of the Berkeley Gilman District. Situated for utmost convenience, this property offers excellent access to I-80, making it an ideal location for a variety of ventures. Whether you're looking to kickstart your own business, establish a creative studio workspace, or explore other possibilities, this property holds great potential for the savvy entrepreneur. Buyer to verify usage with the city. Near Whole Foods, REI, restaurants, The Fourth Street shopping district. Start your own business here. ..
••• https://www. blakestbungalow.com/mls/135285711 ••• Step into serenity with this 2-bed, 1-bath bungalow. Recently refreshed with a freshly painted interior and gleaming refinished hardwood floors this residence exudes warmth and character from the moment you arrive. The newly updated quartz counters and new hardwood flooring in the kitchen elevate both functionality and aesthetics, offering a perfect space for culinary creations and gatherings with loved ones This home boasts an added bonus: a 350sf +/- of finished permitted studio space, complete with heat, updated electrical and new flooring. Think of it as your personal creativity playground– home o
On a quiet, cute street of charming historic homes lies a beautifully maintained 1923 traditional craftsman in a prime location—sought after not only for its walkability to Monterey Market, the gourmet ghetto, highly rated elementary and middle schools, Virginia-McGee Totland, Ohlone dog park, and North Berkeley BART, along with easy 80 freeway access, but also because this is the type of neighborhood that lines the sidewalks with luminarias at Christmas. You get the close community feeling of a small town, yet all the amenities of a bustling city. This 3 bedroom, 1 bath home has kept the features that make a craftsman special—wood flooring, crown moulding, built-in bookcases an
This area's enrollment policy is not based solely on geography. Please check the school district website for more information.
Elementary schools
Middle schools
High schools
GreatSchools Summary Rating
8/10
Ruth Acty Elementary
Public, K-5
8/10
Rosa Parks Environmental Science Magnet School
Public, K-5
8/10
Sylvia Mendez Elementary
Public, K-5 • Choice school
8/10
Cornell Elementary School
Public, K-5
8/10
Marin Elementary School
Public, K-5
Only showing 5 of
20 elementary schools.
School data is provided by GreatSchools, a nonprofit organization. Redfin recommends buyers and renters use GreatSchools information and ratings as a first step, and conduct their own investigation to determine their desired schools or school districts, including by contacting and visiting the schools themselves.Redfin does not endorse or guarantee this information. School service boundaries are intended to be used as a reference only; they may change and are not guaranteed to be accurate. To verify school enrollment eligibility, contact the school district directly.
Homes for sale in Berkeley have a median listing price of $1.2M. Some of these homes are Hot Homes, meaning they're likely to sell quickly.
What are some of the most popular neighborhoods in Berkeley?
Popular neighborhoods include North Berkeley, South Berkeley, Berkeley Hills, Richmond Annex, El Cerrito Hills, North Oakland, Claremont Hills, Claremont Elmwood, West Berkeley, and Fairview Park.
Berkeley, California is well-serviced by a robust public transportation system, including the Bay Area Rapid Transit (BART) and numerous bus lines. The city's traffic levels can be high, particularly during peak commute times, making driving a car a slower option. Berkeley is also conveniently located near several major highways and freeways, providing easy access to surrounding areas. Despite the traffic, the city's extensive public transit and highway access offer a variety of transportation options for residents. Learn more on our Berkeley city guide.
What types of properties are available in Berkeley?
Berkeley, California offers a variety of single-family home types, including ranch-style, modern, and craftsman-style homes. These homes can be found throughout the city, with ranch-style homes commonly located in the North Berkeley and Thousand Oaks neighborhoods, modern homes in the Berkeley Hills and Claremont neighborhoods, and craftsman-style homes in the Elmwood and Berkeley Flats neighborhoods. Most properties feature 2-4 bedrooms and were built between the 1920s and 1950s. To explore different property types for sale in Berkeley, California, use the 'Home type' filter located above the active listings. Customize your search by selecting options like single-family homes, condos, townhomes, and more.
What is life like in Berkeley?
Living in Berkeley, California offers a vibrant and dynamic lifestyle. The city is surrounded by picturesque natural beauty, with hills and parks providing a serene backdrop. The weather is mild and temperate, with a pleasant Mediterranean climate throughout the year. Berkeley boasts a thriving job market, with opportunities in various industries such as technology, education, and research. There is no shortage of activities to engage in, with a plethora of cultural events, art exhibits, music festivals, and outdoor recreational options available.
What are the schools and amenities like in Berkeley?
Berkeley, California offers a multitude of public amenities to its residents. The city is home to a variety of restaurants, catering to a range of culinary tastes. Numerous parks provide spaces for relaxation and enjoyment of the outdoors. Grocery stores are conveniently located throughout the city, ensuring easy access to daily necessities. Additionally, Berkeley boasts other amenities such as libraries, fitness centers, and theaters, contributing to a vibrant community lifestyle.
In the past month, 55 homes have been sold in Berkeley. In addition to houses in Berkeley, there were also 27 condos, 1 townhouse, and 17 multi-family units for sale in Berkeley last month. Berkeley is a fairly walkable city in Alameda County with a Walk Score of 85. Berkeley is home to approximately 112,398 people and 49,890 jobs. Find your dream home in Berkeley using the tools above. Use filters to narrow your search by price, square feet, beds, and baths to find homes that fit your criteria. Our top-rated real estate agents in Berkeley are local experts and are ready to answer your questions about properties, neighborhoods, schools, and the newest listings for sale in Berkeley. Our Berkeley real estate stats and trends will give you more information about home buying and selling trends in Berkeley. If you're looking to sell your home in the Berkeley area, our listing agents can help you get the best price. Redfin is redefining real estate and the home buying process in Berkeley with industry-leading technology, full-service agents, and lower fees that provide a better value for Redfin buyers and sellers.


 REDFIN IS COMMITTED TO AND ABIDES BY THE FAIR HOUSING ACT AND EQUAL OPPORTUNITY ACT. READ REDFIN'S FAIR HOUSING POLICY AND THE NEW YORK STATE FAIR HOUSING NOTICE.
 United States
 Canada