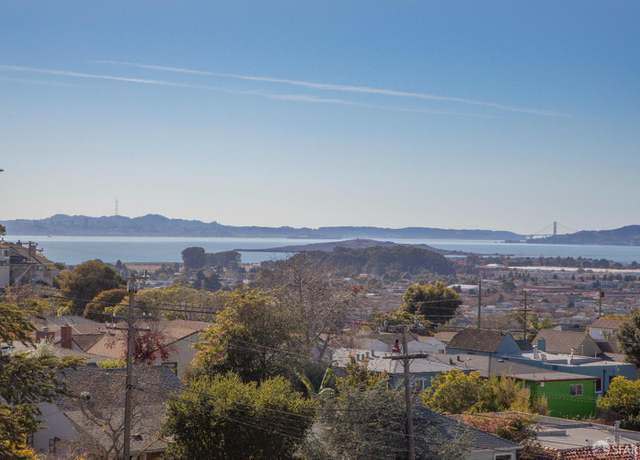
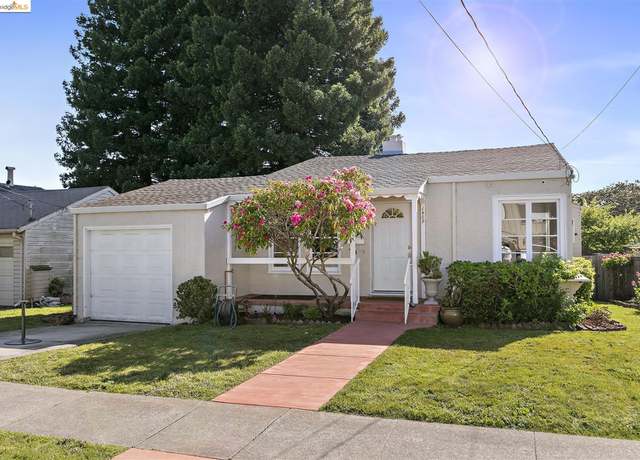
Introducing 7406 Stockton Avenue, a stunning Mediterranean home in El Cerrito! This gem features 3 bedrooms, 2 full bathrooms, and a spacious 1,286 square feet, all set on a generous 5,076 square foot lot. You'll find sleek refinished hardwood floors throughout this home creating a modern and inviting atmosphere. The living room is the perfect spot to unwind, complete with a cozy fireplace for those chilly nights and breathtaking views from Mt Tam, Golden Gate Bridge, Alcatraz and SF. The kitchen is fully upgraded, and the fresh interior and exterior paint give the home a stylish and fresh feel. The primary bedroom offers a peaceful retreat with an en suite bathroom, while the other 2 bedro
A true Mid-Century home, born in 1950 but shines bright with an art deco flair, sits strong in the heart of El Cerrito, just minutes to BART, the Hillside Natural area, fun shops, restaurants, & our awesome Banter Wine Bar! Only two stairs up to the front door as you are welcomed into this home. The entryway leads you to a welcoming foyer, followed by a spacious living room with a fireplace. A formal dining room adjacent to the kitchen marries the incredible preserved charm with practical updates. Updated appliances silhouette the character-filled kitchen with its basketweave tile to the fun retro floors, and don’t forget the curved walls with fabulous unique built-ins perfectly
Views from every level. MUST SEE! Sun drenched, Spacious, 5 Br 2.5Ba View Home in El Cerrito Hills. From the craftsman stone entry the Panoramic Water Views of the San Pablo Bay, Angel Island and Golden Gate Bridge draw you into the light and spacious Living/ Dining room with 9ft exposed redwood beam ceiling and ornate fireplace. Newly remodeled Kitchen with white cabinets, quartz countertops, Italian Carrera Marble tile work and new stainless steel LG Thin-Q appliances. Breakfast nook overlooks the front yard with Evergreens, blooming rose bushes, pink Camelia and even flowering jade. Sunny Side Deck. A large bedroom with walkout balcony to enjoy the water views and SF Skyline, a full bath
Nestled in the heart of vibrant El Cerrito, where ease meets charm. Just moments away from bustling shops, eclectic eateries, and convenient access to public transportation, including buses and two El Cerrito BART stations. Enter into an exquisite Mid-Century marvel, where timeless elegance seamlessly merges with modern comfort, offering you a living experience like no other. Upon entering, you'll be greeted by a sun-kissed open floor plan, adorned with a newly remodeled kitchen boasting SmartTechnology appliances, perfect for effortless entertaining. The tasteful updates complement the spacious interior, enhanced by soft ambient lighting. Venture down the hallway to discover the four bdms.
LOCATION. LOCATION. LOCATION. A rare opportunity awaits you. Conveniently located in El Cerrito with easy access to a myriad of dining, shopping, and entertainment options, along with the convenience of being near the El Cerrito BART station, I-80 and more. Plenty of room for an ADU or Tiny Home. Turn this hidden gem into your dream home!
Perched in El Cerrito’s rolling green hills, this timeless level-in Mid-Century home is framed by uninterrupted views from Golden Gate to Bay Bridge. Featuring a single-level floorplan with all living areas on the main floor and a cozy family room at the lower level, this hilltop hideaway showcases an outdoor deck with sparkling city views. Elevating the everyday with hardwoods and S/S appliances, an updated kitchen boasts quartz counters. Dotted in hydrangea & lavender, a recessed patio welcomes summertime fun.
Located in an especially sought-after part of El Cerrito, this warm and welcoming St Jerome’s home has been meticulously maintained. The cozy living room has a beautiful brick fireplace and opens onto the dining room. The spacious kitchen has a generously-sized pantry and interior access to the garage. The showcase bathroom has elegant tile, ample storage, and a skylight. This single level home has excellent separation between public and private spaces, allowing easy living. The two sunny bedrooms have beautiful garden views, and the primary bedroom has a large closet. The second bedroom has a sliding door with access to the large entertainment deck. The private, rear garden has been
What’s your preference for a view? Whether the Golden Gate Bridge, sunsets, blue waters of SF bay or fireworks on 4th of July, they can be experienced from the back deck off the living room. Welcome to this comfortable home in El Cerrito that gives solitude yet minutes from many conveniences. The living room features a gas fireplace with remote starter. For those that prefer wood, there is plank flooring under the wall-to-wall carpet. The kitchen has a dining counter for those quick meals and all appliances are included. The bathroom has upgrades and has ample cabinet space. Both bedrooms have premium ceiling fans plus the master has a large closet space and a view of the bridge. Acce
Completely level in with incredible VIEWS! This beautiful tudor-style home in El Cerrito offers easy living with original details, views from almost every room, space to expand, and a stunning garden. Even better: 5808 Barrett has been thoughtfully updated with a new heat pump and AC (2022), seismic retrofit (2018), new windows and door along the back of the house (2024), and so much more! Without a single step, enter into the charming entryway that transitions into the grand living room with coved ceilings and classic fireplace. Connected to the living room is the dining room, with attached view deck, awash with natural light and incredible views of San Francisco and the Bay. The views con
Welcome to 1400 Liberty Street. A turnkey fully remodeled home. Own the whole street corner without neighbors to one side of your home. This home was remodeled with timeless updates hand-picked Italian tile, quarts backsplash, a custom black eat-in island, a 36-inch range, a 36-inch refrigerator, gold finishes, a custom range hood, and a custom bench. This home was designed to bring you peace after a long day at work and air conditioning for hot days. The two bedrooms are extra large the ensuite has double sinks and a spa-like shower. The open floor plan is perfect for entertaining. The southward-facing windows bring in plenty of natural light The level backyard is large enough to throw par
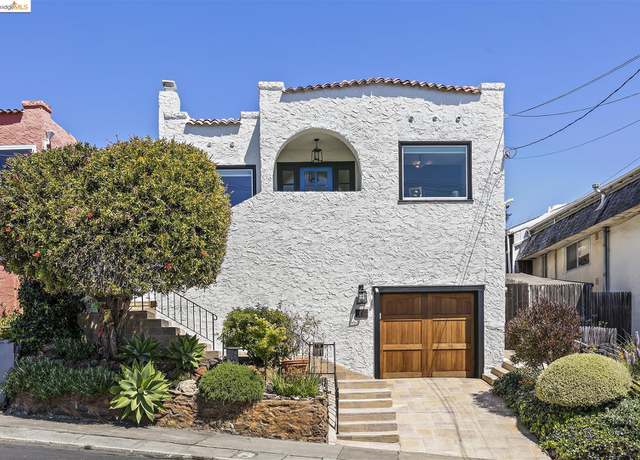
Welcome to this dreamy Mediterranean masterpiece, the epitome of living the California lifestyle. First you will be greeted by a grand picture window, bathing the living space in golden sunshine and setting the stage for serene living. Enjoy picturesque views from both bedrooms overlooking beautiful gardens in both the front and back of the home. The expansive kitchen and pantry seamlessly connect to a spacious private back patio, ideal for effortless movement between indoor/outdoor amenities. The timeless charm of the 1930s is not lost in the elegant living and dining spaces. Additional features include a generous workshop/art studio and a dedicated laundry room, providing convenience and
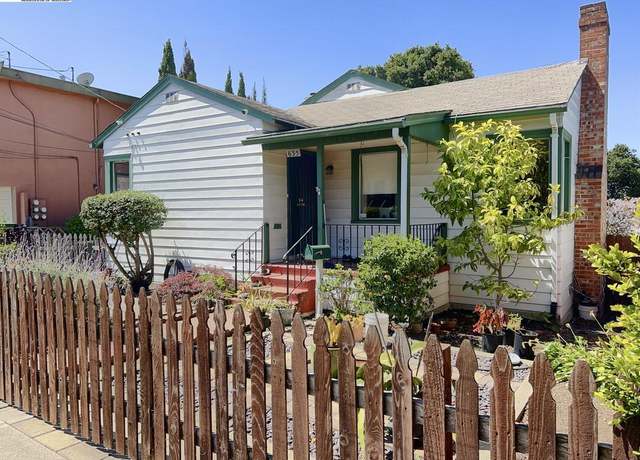
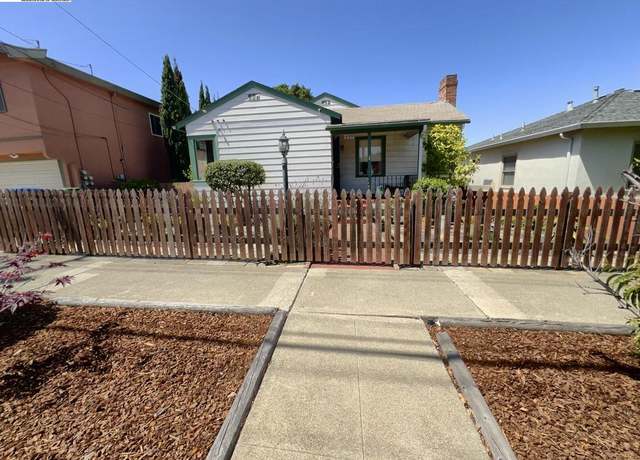
First time on the market in 88+ years! Come & make this charming, sunny, single level meticulously maintained home yours! Tastefully restored while still embodying the original details, craftsmanship, & care of the olden days. 2 spacious bedrooms w/ warm hardwood floors, bonus office/craft room/nursery leads out to the rear yard for gathering & BBQ’s. Kitchen has been updated w/ an eye for clean lines, original aesthetic character in addition to a commercial Viking Range, beautiful hand built cabinets, & marmoleum flooring. A generous living & dining room w/ original built in nooks, 9’ ceilings, restored bathroom w/ clawfoot tub round out the updates.
Welcome to 1735 Liberty Street: a charming El Cerrito bungalow brimming with possibilities, awaiting a new chapter brought to life through your inspiration and design prowess. This home offers a rare opportunity to craft a retreat in a vibrant setting. You're invited to shape and create, envisioning sunlit afternoons in a lush garden or perhaps conjuring up a serene workspace or an accessory dwelling unit (ADU) to complement your lifestyle. Beyond the potential within its walls, this residence is a portal to a life of ease and comfort. Nestled in a community celebrated for its top-tier schools, a medley of shopping experiences, verdant parks, your vision here plants you in the heart of it a
6506 Eureka Ave is a rare gem anchored by a majestic redwood tree—a duplex that embodies the grace and functionality of a single family 1920’s home. This distinguished property, moved from UC Berkeley Campus in the 40’s, offers a harmonious blend of space, style, and versatility with a formal living and dining room, an entertainment room or bedroom, 2 kitchens on the first floor and a family room on the upper level amongst 3 of the 4+ bedrooms. This home is in a prime location near Centennial park, El Cerrito Plaza, Bart, schools, shopping, restaurants, public transportation, all within walking distance.
Welcome to this gorgeous move-in condition home with lots natural lights, Natural landscape rocks and all encompassing view of the Bay Area, San Francisco, and Golden Gate Bridge from multiple rooms, Home features nearly 2415 sqft, lot size nearly 5580 sqft, 3 bedrooms( included master), 2 and half baths, 2 car garage. Main floor has cozy and sunny living, dining, family or office room, Half bath, Remodeled gourmet kitchen and redwood deck for great outdoor entertaiments. Formal staircase leads to top floor for 3 bedrooms(included master with deck/slate floor), Remodeled 2 baths. Lower floor has 2 cars garage, Laundry room, storage or wine cellar. Freshly interior, Exterior paints, New roof
Welcome to 6762 Glen Mawr, a gracious and inviting, sun-filled home, with mid-century inspired architecture, amazing storage space, an open-air backyard barbecue hut with an outdoor fireplace, and a beautiful and delicious yard, bordered by a backdrop of trees. The owner, J. , shared what she loved most about her home. She highlighted her garden, her wonderful neighbors, her prolific, drought tolerant, Meyer lemon tree, and her unique self-designed, tiled front porch that welcomed her and others into the home. as well as the lush garden, brimming with raspberries, blueberries, kale, chard, figs, lemons, roses, lilies and mint. This special home features two-bedrooms, a fun retro bath, a spa
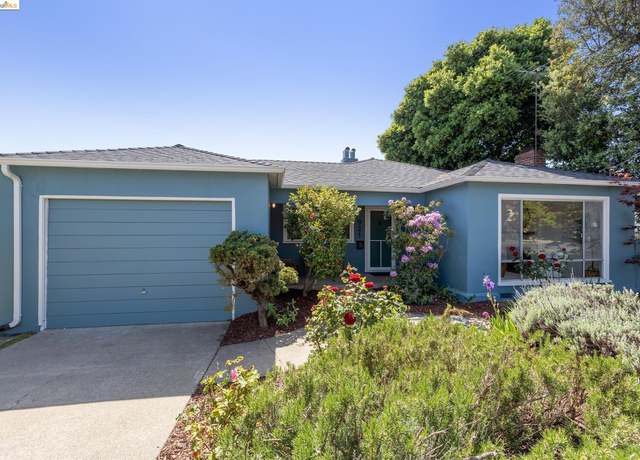
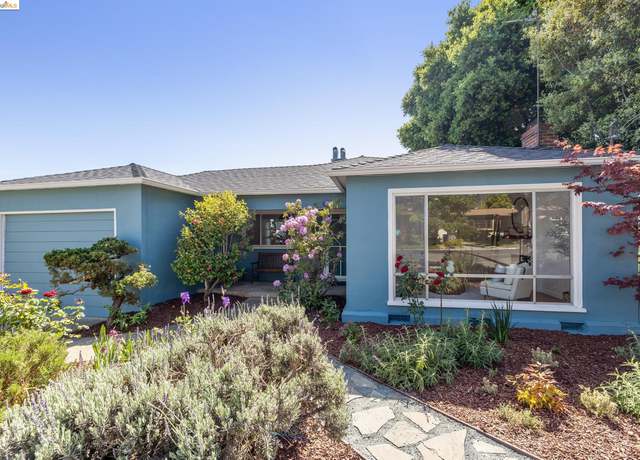
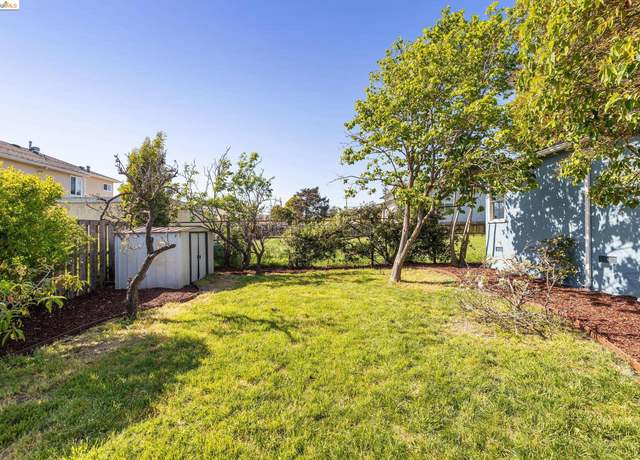
Located in highly coveted Country Club Hills, this lovely home with sweeping bay views has been newly renovated top to bottom and is move-in ready! This 1,863 sq ft, 4 bedroom, 2 bath home has all new exterior and interior paint, carpet, lighting fixtures and gleaming hardwood flooring. On the main level you will find a formal living and dining area with picture window and wood burning fireplace, all leading to updated eat-in kitchen with new gas stove top, new microwave, built-in oven, stone counters, laundry closet and slider to back patio and split-level yard. Primary bedroom is also located on the main level with remodeled bathroom with vanity with quartz counter, shower and designer to
Welcome to your newly renovated home, where modern luxury meets thoughtful design. One bedroom one bath on 1st floor; two bedrooms one bath on 2nd floor. Step through the new entry porch into a charming first floor, melding kitchen and living spaces. The brand-new kitchen boasts new cabinets, island, and appliances. Ascend the stylish new staircase to discover the comfy second-floor space. Indulge in two opulent bathrooms adorned with high-end fixtures, offering a touch of luxury to your daily routine. New electric wires, new plumbing, new GFCI and AFCI circuits, new windows and doors throughout the home. Convenience, comfort, and safety features include a new roof, new luxury water-resista
With mid-century provenance, one-level living, and beautiful updates, 5457 Barrett Avenue is an El Cerrito treasure. Set back from the street, the private courtyard offers a peaceful and perfect entrance befitting this lovely home. The stunning original floor tile in the entrance opens to a spacious family room with gas-insert floor-to-ceiling brick fireplace which flows into an elegant dining room. The kitchen, renovated with permits in 2021 is a cheerful respite - a perfect place for a home chef to create and entertain as the eat-in area sits next to a sunny sliding glass door that opens to the wrap-around deck. Four spacious bedrooms - one of which is an en-suite with adjoining bathroom
Offering panoramic vistas of the bay, Golden Gate Bridge, and San Francisco skyline from multiple rooms, the abundant windows and skylights bathe this home in natural light. The brand-new kitchen is complete with custom cabinets, quartz countertops, and stainless-steel appliances, gas range and breakfast bar. The kitchen seamlessly flows into the family room with a fireplace, creating the perfect space for gatherings and relaxation. Entertain with ease on the sizeable deck and yard off the kitchen/family room. Main level features a living room, sunroom, dining room and a separate office space, all illuminated by recessed modern lighting and featuring refinished hardwood floors. Two bedrooms
Great value in El Cerrito Hills! This 4,969 square foot sanctuary is designed for those who appreciate beauty, seek comfort, and demand value. Home offers six total bedrooms, of which two are on the first floor, making this home perfect for multigenerational living. This landmark Art Deco home, is a lifestyle statement for those with an appreciation for history, art, and architecture, offering a unique blend of timeless elegance and modern functionality. With its distinctive geometric shapes, and elegant lines, this property offers a rare opportunity to own a piece of architectural history. Media includes virtual staging. Open Sunday 4/21 2-4.
Introducing El Cerrito, a vibrant city in Contra Costa County, California, that's a part of the bustling San Francisco Bay Area. Known for its rich history and unique characteristics, this charming city is sure to enchant you. Step into this captivating abode, where attention to detail reaches new heights. The windows, sourced from a prestigious New York-based company specializing in skyscraper window design, showcase exquisite craftsmanship. These tempered plate glass windows bring style and functionality, enhancing the property's overall allure. The exterior of the home is equally appealing, with redwood construction safeguarded by vinyl siding. This ensures the home remains visually stun
Rare opportunity to own an investment property with exceptional-quality rarely available in El Cerrito. This well-maintained property reflects pride of ownership with a strong rental market. Great location with lots of shops, public transportation and restaurants near by
Rare DUPLEX opportunity! 6370 Eureka Avenue, El Cerrito, California is near El Cerrito Plaza BART, making commuting around the Bay Area easy and convenient to San Francisco and beyond. Built in 1927 when craftmanship truly counted, each unit: 2 beds, 1 bath, attached garage with laundry. Original hardwood floors, built-ins, high ceilings, vintage charm. Corner lot by Fairmont Elementary. Both units are currently rented with tenants wanting to stay.
Rare opportunity to own one of only 14 condos in this highly desirable, gated, craftsman style building, known as Lexington Gardens. First floor, end unit location. Common area courtyard with mature landscaping, seating and community grill. Spacious, secured underground parking and additional storage room. A commuter's dream, with easy access to AC Transit and only one block from BART. Amazing walkability. Close to El Cerrito Plaza shopping, banking, post office and Giovanni's Produce and Grocery. Two bedrooms, one bathroom, indoor laundry, fireplace and fenced decking. Move-in ready with new paint, new lighting and new carpeting. Open floorplan with a living/dining room combo. F
You know that view that everyone loves? Own it! Along with stupendous San Francisco Bay Views, this property is mostly level, set away from the street by virtue of being a flag lot, and it has architectural renderings to help visualize what you can build. Flag lots like this do not come along everyday. Go up and see to appreciate all of this properties attributes.
Located on one of the most coveted streets in El Cerrito 956 Sea View Drive is a shovel ready premium parcel new construction opportunity you’ve been searching for. Primed as either a new construction spec house or fabulous retail end user residence, this property offers sweeping panoramas from Marin to San Francisco to Peninsula. The plans for this sleek modern home afford unobstructed views of the Golden Gate Bridge. Title 24, entitlements, soils, survey, engineering, permits & plans included with sale. With 3,200sf of luxurious living space, 1,300sf full floor rooftop deck, 1,200sf of additional exterior space, the 5bd 3.5ba floorplan personifies contemporary design with time
The offering comprises an entitled 44-unit development opportunity located in the heart of El Cerrito along San Pablo Avenue and Lincoln Avenue. The site is a ±18,423 sf corner lot comprised of two adjoining parcels (APN: 504-012-036-1 / 504-012-037) situated in the TOHIMU (Transit-Oriented Higher-Intensity Mixed Use) zoning district. The building is a contemporary style with a unique mix of 2 and 3 bedroom condos, flats and townhomes with private patios/decks and Bay, City and Hill views. Located walking distance from the growing Downtown area which is home to many national retailers plus abundant transit options make this an ideal property for residents who want a convenient, urban
This 7500 sq ft vacant lot for sale is in a prime location on the corner of San Pablo Ave and Waldo in El Cerrito, CA. Located just 5 blocks north of El Cerrito Plaza, the lot offers easy access to shopping, dining, and transportation options. The Transit Oriented Higher Intensity Mixed Use (TOHIMU) zoning provides numerous development opportunities, with the potential for up to 35 units (buyer to verify with City regarding zoning and use). This is an ideal opportunity for investors and developers to create their next project in a sought-after area. Don't miss out on this rare chance to own a corner lot with excellent potential in a prime location.
This area's enrollment policy is not based solely on geography. Please check the school district website for more information.
Elementary schools
Middle schools
High schools
GreatSchools Summary Rating
6/10
Madera Elementary School
Public, K-6
5/10
Harding Elementary School
Public, K-6
4/10
Wilson Elementary School
Public, K-6
3/10
Fairmont Elementary School
Public, K-6
3/10
Stege Elementary School
Public, K-6
Only showing 5 of
6 elementary schools.
School data is provided by GreatSchools, a nonprofit organization. Redfin recommends buyers and renters use GreatSchools information and ratings as a first step, and conduct their own investigation to determine their desired schools or school districts, including by contacting and visiting the schools themselves.Redfin does not endorse or guarantee this information. School service boundaries are intended to be used as a reference only; they may change and are not guaranteed to be accurate. To verify school enrollment eligibility, contact the school district directly.
Homes for sale in El Cerrito have a median listing price of $949K. Some of these homes are Hot Homes, meaning they're likely to sell quickly.
What are some of the most popular neighborhoods in El Cerrito?
Popular neighborhoods include Midtown, Park View, West Albany, Plaza, North Northwest Pensacola, Southwest Richmond Annex, Richmond Annex, El Cerrito Hills, Oceanage Condominium, and Del Norte.
El Cerrito, California offers a variety of transportation options, including a well-connected public transportation system. The city is served by two BART stations, El Cerrito Plaza and El Cerrito Del Norte, providing residents with easy access to surrounding areas. For those who prefer to travel by car, traffic levels can vary, but typically peak during morning and evening rush hours. Additionally, El Cerrito is conveniently located near several major highways and freeways, including Interstate 80 and State Route 123, facilitating efficient travel throughout the region. Learn more on our El Cerrito city guide.
What types of properties are available in El Cerrito?
El Cerrito, California offers a variety of single-family home types, including ranch-style, contemporary, and modern homes, among others. These homes can be found throughout El Cerrito, California, in neighborhoods such as El Cerrito Hills, Mira Vista, and Richmond View. Most properties in El Cerrito, California feature 2-4 bedrooms and were built in various years. To explore different property types for sale in El Cerrito, California, use the 'Home type' filter located above the active listings. Customize your search by selecting options like single-family homes, condos, townhomes, and more.
What is life like in El Cerrito?
El Cerrito, California offers a pleasant living experience with its charming surroundings. The landscape is characterized by rolling hills and lush greenery, providing a serene and picturesque environment. The weather in El Cerrito is typically mild, with warm summers and cool winters, allowing for a comfortable outdoor lifestyle. The city provides a range of job opportunities across various industries, ensuring residents have access to diverse employment options. There are plenty of activities to engage in, including exploring local parks, enjoying outdoor recreational activities, and experiencing the vibrant local arts and cultural scene.
What are the schools and amenities like in El Cerrito?
El Cerrito, California, offers a variety of public amenities to its residents. You can enjoy a meal at one of the many restaurants or shop for your daily needs at local grocery stores. The city boasts several parks for outdoor leisure and relaxation. More amenities include schools, libraries, and a post office. Additionally, public transportation is readily available for easy commuting within the city.
In the past month, 11 homes have been sold in El Cerrito. In addition to houses in El Cerrito, there were also 2 condos, 3 townhouses, and 2 multi-family units for sale in El Cerrito last month. El Cerrito is a moderately walkable city in Contra Costa County with a Walk Score of 67. El Cerrito is home to approximately 23,322 people and 5,447 jobs. Find your dream home in El Cerrito using the tools above. Use filters to narrow your search by price, square feet, beds, and baths to find homes that fit your criteria. Our top-rated real estate agents in El Cerrito are local experts and are ready to answer your questions about properties, neighborhoods, schools, and the newest listings for sale in El Cerrito. Our El Cerrito real estate stats and trends will give you more information about home buying and selling trends in El Cerrito. If you're looking to sell your home in the El Cerrito area, our listing agents can help you get the best price. Redfin is redefining real estate and the home buying process in El Cerrito with industry-leading technology, full-service agents, and lower fees that provide a better value for Redfin buyers and sellers.


 REDFIN IS COMMITTED TO AND ABIDES BY THE FAIR HOUSING ACT AND EQUAL OPPORTUNITY ACT. READ REDFIN'S FAIR HOUSING POLICY AND THE NEW YORK STATE FAIR HOUSING NOTICE.
 United States
 Canada