Your forever home awaits!! This is a stunning home located in the desired area of Rialto that won't last long. As you walk into this 4 bedroom, 2 bath, 1556 sqft home, you will notice the pride of ownership on display. Open the door and you will walk into the large living room which leads into the formal dining room, creating an open concept living area with a lovely gas fireplace. Pass the formal dining room and enter into the spacious kitchen with middle island, perfect for entertaining. The kitchen has plenty of cabinet space and also has a breakfast bar that looks into the living room. Continue down the hallway and you come to the first bedroom on your right-hand side. Continue to the s
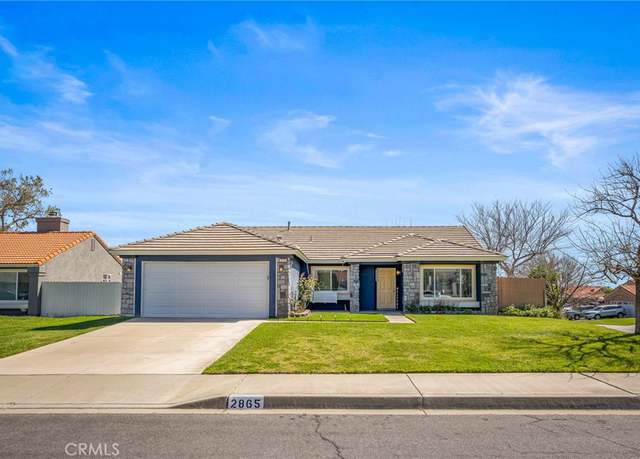
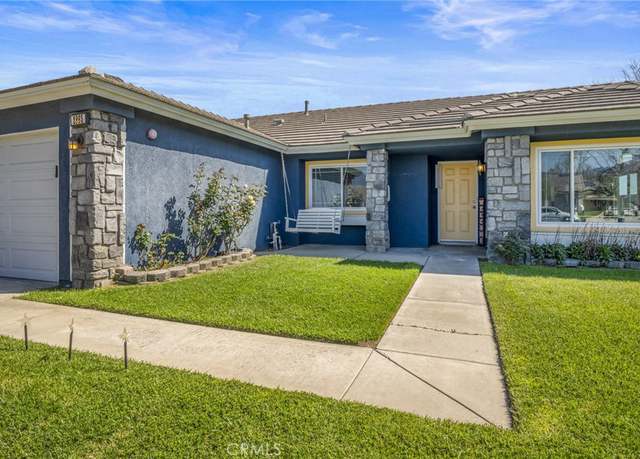
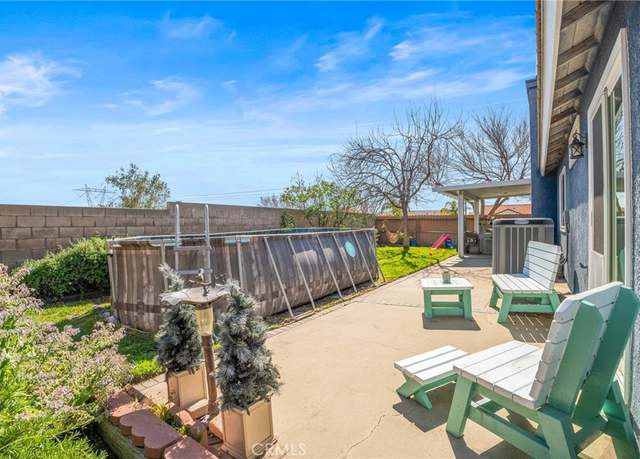
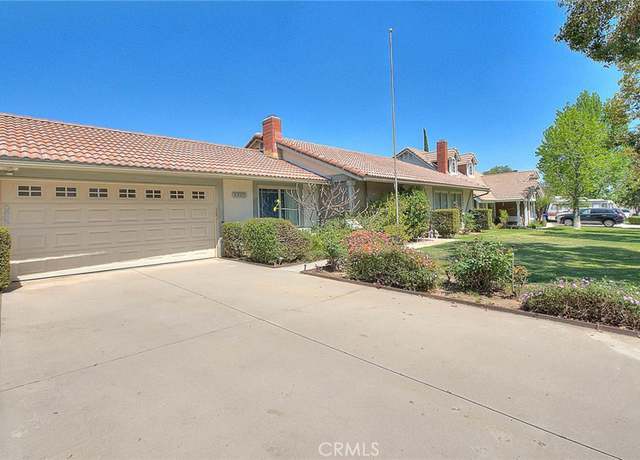
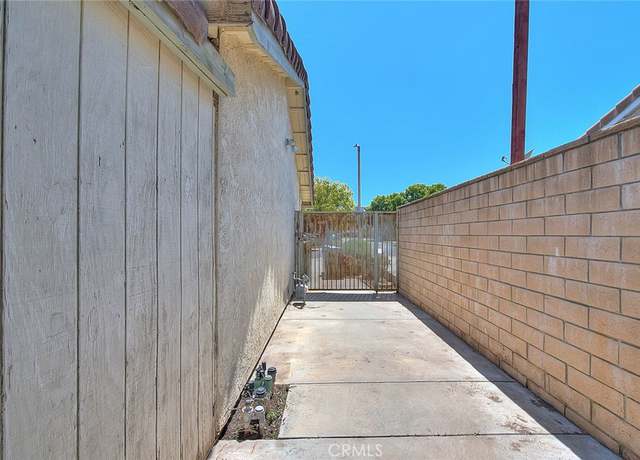
Welcome to this Charming Single Story home in a quiet neighborhood! Step inside and be greeted by a cozy fireplace in the living room, perfect for those chilly evenings. This property offers flexible living space in 3 bedrooms and 2 full baths. Tile roof and Large back yard with block walls. Also features granite counter tops. With some TLC this property could be your dream home.
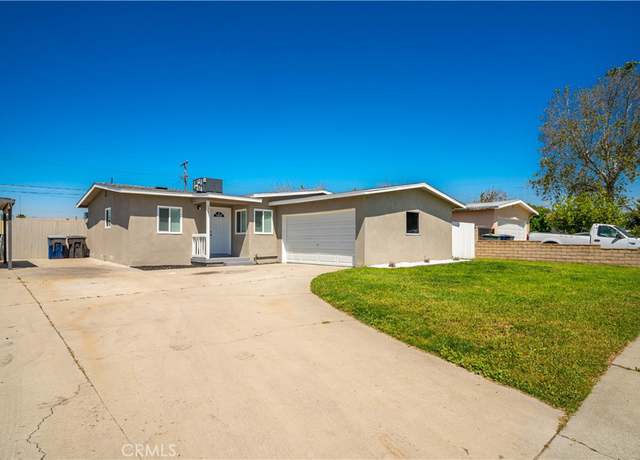
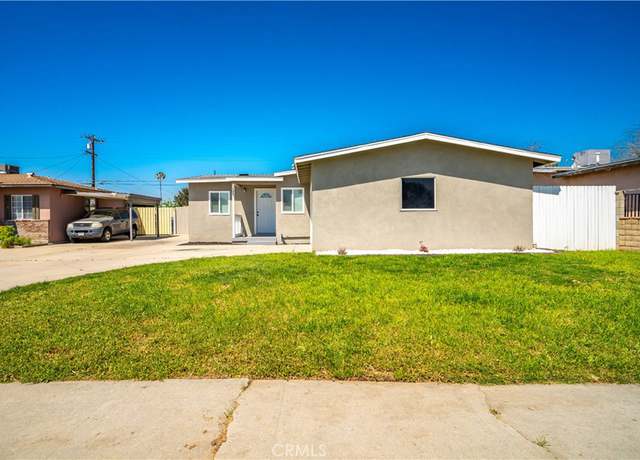
For Sale only Located in the City of Rialto you will find is this Beautiful and cozy 3 bedrooms and 1 bath home offering an open floor plan for entertainment, As you walk in to this amazing home you are greeted by beautiful open spacious living room, a nice open floor plan flows nicely, brightly lit with lots of windows, A remodeled kitchen with new cabinets, quartz counters, new sink, new flooring. Remodeled bathroom with new cabinets, new quartz counter, new flooring and all new fixtures and so many others upgrade! Step out to a spacious fenced in backyard, What a great home for BBQ's and parties with friends to gather and enjoy. COME AND SEE THIS GREAT OPPORTUNITY !! IT WILL NOT LAST !!
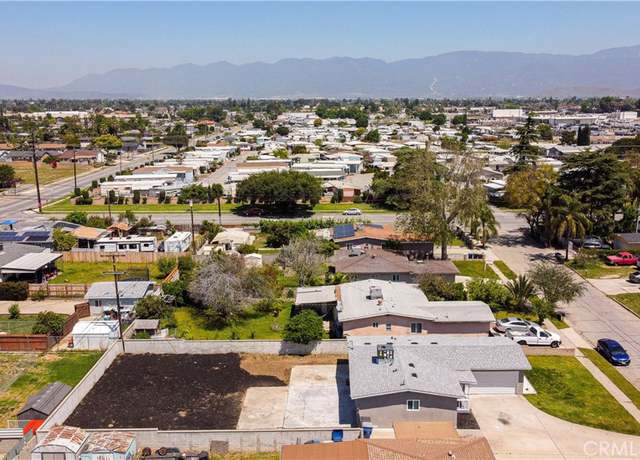
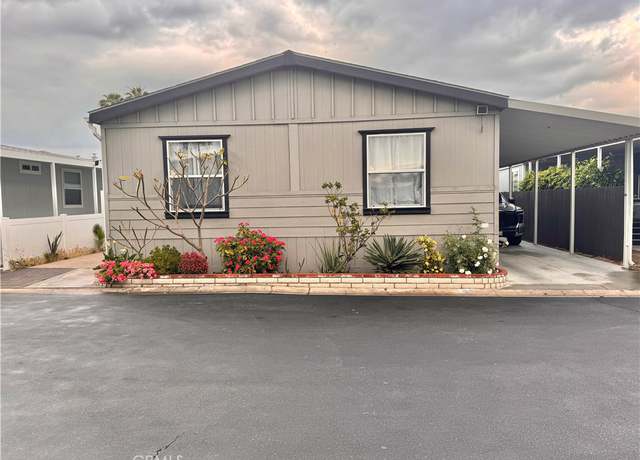
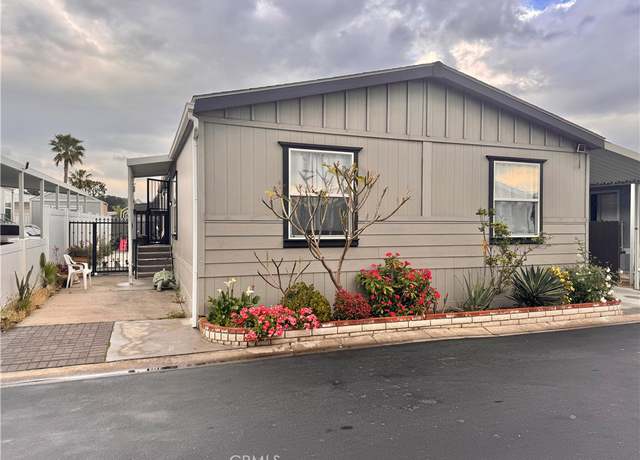
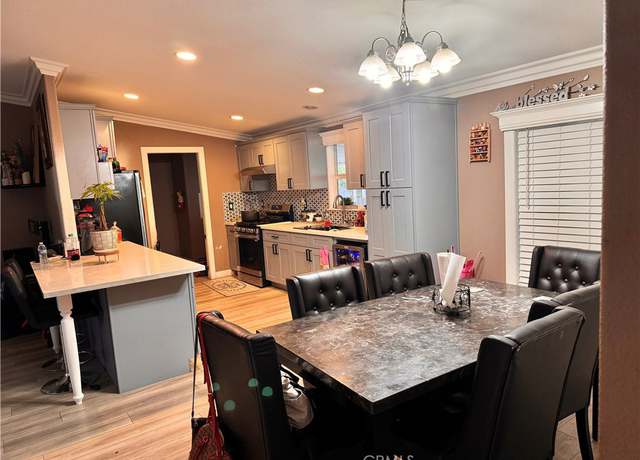
Welcome to this new listing for a spacious 3-Bedroom, 2-Bathroom with a bonus room, manufactured home located in the heart of Rialto, CA. This property boasts a low land lease and a host of amenities, all within close proximity to local coveniences. It offers a unique blend of comfort and covenience, perfect for anyone looking for a new place to call home.
Homes like this one don't come around too often. Come by and take a look at this large 4 bedroom home in the city of Rialto. From the moment you step in you'll notice the pride of ownership here. Tile flooring decorates the first floor as you step in. The 1st floor features a formal dining space, a down stairs bedroom and full bath, and a nice family room that is an open concept to the kitchen. The kitchen has upgraded cabinets and countertops, with plenty of cabinet space. Just outside of the living area is an enclosed sun room which is great to host family or have a designated area for your kids to play. Upstairs you'll find a loft area that can easily be converted into an additional room
NEW HOMES IN BLOOMINGTON. CEDAR VILLAS COMMUNITY OFFERS THREE SPACIOUS FLOOR PLANS FROM 3 TO 4 BEDROOMS, LOW TAX RATE, ENERGY EFFICIENT STAINLESS STEEL ENERGY RATED APPLIANCES, QUARTZ COUNTERTOPS WITH 4" BACKSPLASH. CLOSE PROXIMITY TO SCHOOLS, I-10 FREEWAYS, SHOPPING CENTERS, RESTAURANTS, ONTARIO INTERNATIONAL AIRPORT AND OTHER AMENITIES.
NEW HOMES IN BLOOMINGTON. CEDAR VILLAS COMMUNITY OFFERS THREE SPACIOUS FLOOR PLANS FROM 3 TO 4 BEDROOMS, LOW TAX RATE, ENERGY EFFICIENT STAINLESS STEEL ENERGY RATED APPLIANCES, QUARTZ COUNTERTOPS WITH 4" BACKSPLASH. CLOSE PROXIMITY TO SCHOOLS, I-10 FREEWAYS, SHOPPING CENTERS, RESTAURANTS, ONTARIO INTERNATIONAL AIRPORT AND OTHER AMENITIES.
NEW HOMES IN BLOOMINGTON. CEDAR VILLAS COMMUNITY OFFERS THREE SPACIOUS FLOOR PLANS FROM 3 TO 4 BEDROOMS, LOW TAX RATE, ENERGY EFFICIENT STAINLESS STEEL ENERGY RATED APPLIANCES, QUARTZ COUNTERTOPS WITH 4" BACKSPLASH. CLOSE PROXIMITY TO SCHOOLS, I-10 FREEWAYS, SHOPPING CENTERS, RESTAURANTS, ONTARIO INTERNATIONAL AIRPORT AND OTHER AMENITIES.
Nestled in a serene neighborhood, this impeccable residence offers the perfect combination of style, comfort, and eco-friendliness. Step inside and experience the ultimate in modern living. Spread over two stories, this home boasts ample space for your family to grow and thrive. There are four generously sized bedrooms, and three bathrooms, and a bonus loft on the 2nd floor that can be used as a home office, play area, or media room. The first floor has an open-concept kitchen that opens to the dining and living rooms, perfect for entertaining. Vinyl floors throughout with new carpet in the first-floor guest room and one room upstairs. Recessed lighting in the kitchen, living room, and loft
NEW HOMES IN BLOOMINGTON. CEDAR VILLAS COMMUNITY OFFERS THREE SPACIOUS FLOOR PLANS FROM 3 TO 4 BEDROOMS, LOW TAX RATE, ENERGY EFFICIENT STAINLESS STEEL ENERGY RATED APPLIANCES, QUARTZ COUNTERTOPS WITH 4" BACKSPLASH. CLOSE PROXIMITY TO SCHOOLS, I-10 FREEWAYS, SHOPPING CENTERS, RESTAURANTS, ONTARIO INTERNATIONAL AIRPORT AND OTHER AMENITIES.
Welcome to this beautiful updated 2 story home situated at the end of a quiet cul-de-sac! This home features four bedrooms and two and a half bathrooms, making it an ideal family home. This home features all new interior paint throughout the home, new vinyl flooring, all new recessed lighting, including new windows! The formal living room has high volume cathedral ceilings and a separate cozy family room with a beautiful fireplace. The fully renovated kitchen has new cabinets, new quartz countertops & updated backsplash. The private master bedroom also has high ceilings with his and her sinks in the restroom. This home also has solar, perfect for the upcoming summer months. The commun
Welcome to PARQUE a clean and quiet 55+ mobile home park. Home features two bedrooms, one bath, covered patio, in unit laundry hookups, Livingroom, Kitchen and Breakfast Nook. Newly remodeled Kitchen and Freshly Painted Interior. Nicely landscaped yard with many fruit trees, (mango, orange, lemon and pomegranate to name a few). Park has community laundry facility, club house and a sparkling pool. Photos will be uploaded soon, and additional details to follow.
Presenting an exquisite two-story residence nestled in the prestigious Walnut Village, showcasing impeccable curb appeal adorned with meticulously manicured lawns and vibrant flora. Upon entry, this remarkable abode boasts four bedrooms and three full baths, including a rare ground-floor suite with full bath, complemented by a captivating open-concept living area exuding spaciousness and luminosity. The inviting family room, featuring a cozy fireplace, seamlessly connects to the well-appointed kitchen with ample cabinetry and space for additional dining arrangements. Ascend to the second level to discover an expansive master suite with indulgent bath, alongside two generously sized bedrooms
BUILDERS DREAM LOT OF 21,000 SQURE FEET WITH FULLY APPROVED, PERMIT READY 1200 SQ FT ADU PLANS PAY YOUR SCHOOL FEES AND PERMIT FEES AND START CONSTRUCTION SEWER CONNECTS TO EXISTING SFR SEWER CONNECTION FEE WAIVER FOR NEW WATER METER ($0 COST FOR WATER LATERAL AND METER) NO FIRE SPRINKLERS REQUIRED FOR ADU SALE INCLUDES SURVEY, SOILS REPORT ADU PLANS AND STRUCTUAL CALCULATIONS REQUIRED FOR PERMIT ISSUANCE THE LOT WILL ALLOW 2 MORE ADDITIONAL UNITS OF NEW CONSTRUCTION. BUYER TO COMPLETE THEIR OWN DUE DILIGENCE WITH CITY
• Welcome to your dream home nestled in a tranquil cul-de-sac located in a beautiful neighborhood. This move-in ready residence offers a perfect blend of comfort, style, and potential for customization to suit your lifestyle. The living room features an open layout design, allowing for effortless transition from indoor relaxation to outdoor enjoyment. In warmer months, the patio becomes an extension of your living space, offering the ideal setting for outdoor barbecues, morning coffee, or simply soaking up the sunshine. The backyard has mature fruit trees and a large space where you could add a pool or create your personalized garden tailored to your taste. On top of all that it has a
Welcome to your new home nestled in the heart of Rialto, California. This delightful property at 443 S Tamarisk Ave offers comfort, space, and the perfect place to call HOME or add to your investment portfolio. This freshly painted single story HOME offers 4 large bedrooms, 2 full baths, it provides ample room for both relaxation and entertainment. Upon entering, you're greeted by a bright and airy living space with high ceilings, adorned with tasteful finishes and plenty of natural light. The open layout seamlessly connects the living, dining, and kitchen areas, creating an inviting atmosphere for gatherings by the double-sided fireplace and everyday living. This property also includes a s
Welcome to this highly desirable large Corner lot home in North Rialto with a built-in pool and spa. This home features 4 bedrooms, 2.5 baths, 1,857 sq ft of living space on an 8,500 sq ft lot. You are welcomed with 2 wings on the main level. To the left on entry is a 2 story living room wide open to the dining room. The other wing has a family room with a fireplace, wide open to the kitchen with Beechwood cabinets and new appliances. Rounding out the first floor is a half bath and direct access to 2 car garage with a storage room. There are 2 sliders to the large wrap-around yard, one from the family room and one from the living room which additionally has an alumna wood patio cover. All 4
Recent Remodel move in condition, Huge yard with plenty of space to build ADU or convert the huge garage to an ADU. New laminate wood flooring new tile in both baths and kitchen, indoor laundry, RV Parking. Newer duel pane windows, new interior and exterior paint.
EXCELLENT For First Time Buyers Or As An Investment Opportunity! Nice Neighborhood. Close to two Elementary schools and a High School. Close to businesses, supermarkets, Fwys 210/215/15 and 10. GREAT SCHOOLS Within Walking Distance! Good sized Back Yard perfect for entertainment, or build your own swimming pool. Trees and Palms for landscaping. Property located in North Rialto. Newer Roof around two years, Newer Cabinets around one year. Granite counter top. Laminate flooring. Two-Car garage. WILL NOT LAST IN THIS CONDITION, THIS AREA, AT THIS PRICE!
Beautiful turnkey home in the Sierra Crest community in North Fontana. No HOA. Home is across from a neighborhood park with a large green open field. 4 bedrooms with 3 and one-half baths. Main floor features a bedroom with a private full bath, a chef’s kitchen with an oversized island that opens to a generously sized living room, and an additional half bath for guests. The upper level boasts a primary suite with a nice mountain view, two bedrooms with walk-in closets, laundry room, and a spacious loft for your home office or entertainment. Low maintenance front and back yards. Plenty of outdoor parking space. Easy access to the 15 and 210 freeways. Note: Solar lease is $90.26 per mont
Bankruptcy Court Equity Sale - Welcome to Rialto and this 3 bedroom, 2 bath home on a large lot of 9,000 square feet. Nice floor plan and plenty of room to add square footage. Fireplace in the living room, family room off the kitchen, and spacious master bedroom.
Welcome to your newly remodeled home in the vibrant community of Colton, CA. This property has undergone extensive updates, featuring new flooring, fresh paint, top-of-the-line appliances, and energy-efficient windows for a stylish and comfortable living environment. Conveniently located close to shopping centers and just minutes from the 10 Freeway, this home provides seamless access to daily conveniences and easy commuting options. It's perfectly situated for quick trips to local amenities and beyond. Inside, you'll find a thoughtfully designed space that maximizes both style and functionality, including a versatile bonus room. This additional space is ideal for a home office, playroom, o
Located in the sought out area of Sierra Crest this Spanish style beauty is priced to sell. One of the most functional floorplans you will find this home has been meticuosly cared for. The heart of the home lies in the oversized kitchen that attaches to the eating area and generous family room. Access to the formal dining area is easy and includes a butlers pantry and gracious storage pantry. A convenient home office nook was built in to the floorplan and can serve many functions. The master suite is hotel worthy and features a walk in closet that doesn’t skimp on size. The upstairs contains a large loft that can house all sorts of gaming room options including the perfect place for
Nestled in the heart of Rialto's most desire north side, this charming single-story home offers comfortable living and modern amenities in a prime location. Boasting 3 bedrooms, 2 bathrooms, As you step inside, you'll immediately notice the attention to detail, starting with the double-pane windows that flood the home with natural light. The interior features additional updates, with select areas receiving a fresh coat of paint to give the home a modern and vibrant feel illuminated by natural light, creating a welcoming ambiance throughout. The kitchen is a culinary delight, equipped with granite countertops, enjoying a quick breakfast at the cozy dining nook, this kitchen is sure to inspir
BEST FLOORPLAN IN THE GATED COMMUNITY AND A CORNER UNIT! Welcome to this very well-maintained townhome in Rialto which features 3 bedrooms, 2.5 bathrooms, quartz counters, a spacious and open floorplan, attached 2-car garage, a balcony, laminate floors downstairs, carpet upstairs, and tile in the bathrooms and laundry room, tankless water heater, and a LOW SOLAR payment of $66/month. This is perfect for a small or growing family or busy professionals. Conveniently located near grocery stores, gas stations, a Starbucks across the street, a 10-minute drive from the Renaissance Marketplace (luxury theater, restaurants, fast-food, bars) and between the 210 & 10 FWY! HOA covers community m
What a Deal! Two Story Family Pool home in Rialto, Cedar Park Greens Community, Features 3 Bedrooms, 2.5 Bathrooms, Living Room with Fireplace, Dining Room, Family Room, and Kitchen. The Kitchen has tiled floors, newer style cabinets, countertop and appliances. Half Bathroom Downstairs, All Bedrooms and additional Bathrooms are upstairs, The Bedrooms are all a good size. The Master Bedroom is large with attached Bathroom. Indoor Laundry, The Rear Yard is well landscaped with patio area and private in ground pool and spa. Attached Two Car Garage with driveway. Close to shopping, Schools and more.
GORGEOUS REMODLED HOME, TURNKEY TRUE PRIDE OF OWNERSHIP. HUGE BEAUTIFUL KITCHEN WITH CUSTOM COUNTERS AND BACKPLASH, AMAZING FARMHOUSE FLOORPAN PRIMARY WITH HUGE WALK IN CLOSET AND DOUBLE SINKS AND A SECOND BEDROOM DOWNSTAIRS HUGE BEDROOM AND WALK IN CLOSET UPSTAIRS. GENEROUS DINING ROOM AND FAMILY ROOM WITH A FIREPLACE. AN ADDITIONAL FAMILY ROOM WITH TONS OF NATURAL LIGHT IS OFF OF THE FORMAL LIVING ROOM AND EXTRA SQUARE FEET!! NEW WINDOWS TWO CAR ATTACHED GARAGE. VERY PRIVATE CORNER LOT WITH A NEIGHBOR ON ONLY ONE SIDE. NO NEIGHBORS BEHIND.
Welcome HOME to this beautiful remodeled home. This is a 3 bedroom 1 bath totally upgraded open floorplan. This home is move-in ready! Pull up to a beautiful fully landscaped front yard, a plenty of parking spaces on the front. The entrance welcomes you to formal living room. The kitchen has new countertops. New vanity, faucet and toilet. New floors. Fresh paint inside and outside. But wait, cherry on top, this home has a pool and a large Back Yard. Don't miss out.
Welcome to your dream home at 400 E. Cornell Dr. in the heart of Rialto, CA. This fully renovated property offers a perfect blend of luxury, comfort, and convenience, with modern upgrades and attention to detail throughout. Located on a spacious 10,500 square foot lot, this home features three bedrooms and two bathrooms, providing ample space for your family. The interior offers an open floor plan filled with both, natural and recessed lighting. The kitchen boasts brand new soft close white shaker cabinets, white subway tile backsplash, a sleek quartz countertop finish, and stainless-steel appliances! Both bathrooms have been beautifully renovated with a modern design. This home also featur
NEW CONSTRUCTION! Ready for immediate move-in! Upgraded Flooring Included! This two-story home features a generous open floorplan shared between the kitchen, dining room and Great Room, with sliding glass doors that lead to the outdoor space. A secondary bedroom is found off the entryway, great for overnight guests. Upstairs is a versatile loft surrounded by three bedrooms, including the owner’s suite which is comprised of a bedroom, en-suite bathroom and walk-in closet. Edgestone is a collection of new single-family homes for sale at the River Ranch masterplan in Rialto, CA. Residents enjoy a recreation center with a pool, plus onsite parks and trails for outdoor enjoyment. Shopping
For just $380,000, seize the fantastic opportunity to own a charming home! This single-family residence offers two bedrooms, one bathroom (plus a den), and is currently zoned as a legal non-conforming SFR in an M-1 (Light Manufacturing Zoning). The property is versatile, suitable for use as either a residence or a business, as per allowable M-1 uses. These include options like a restaurant or cafe, electric vehicle charging station, auto shop, machine or appliance assembly, bakery, food product manufacturing, and various other light manufacturing uses. Please ensure to verify all usage possibilities with the City of Rialto. The property features a spacious driveway with direct access to the
AMAZING POTENTIAL. NO HOA. Transform this Rialto house into your dream home! This two-story home offers 2048 square feet of living space, featuring 4 bedrooms, 3 bathrooms, and a 3-car garage. As you step in, your immediate view will be a formal Living Room and dining room combination. In the kitchen, you'll find granite countertops, a double sink, upgraded cabinets and a built-in wine rack. Next to the kitchen, there's a spacious family room featuring a cozy fireplace and ample space for entertaining your guests. The primary bedroom suite includes an en-suite bathroom equipped with a walk-in closet, dual sinks, tub and shower combo and privacy toilet door. The large backyard has huge pote
The Moonstone floor plan opens with a downstairs bedroom and full bath. At the back of the home, you'll find a dining area, a great room, and a kitchen with a center island and access to the backyard. Open stair railing will lead you to the second floor where you will find the owner's suite which includes a walk-in closet and an attached bathroom. Upstairs also features a laundry area, three bedrooms and a bathroom with double sinks, as well as a loft. Upgrades include: Miami Vena Quartz Countertop in kitchen, Cultured Marble Countertops in restrooms and staggered tile flooring in wet areas of the home.
Built in 1990, this beautiful single-story home is located in the sought after "Las Colinas" community. This home is a must see! three bedrooms, and two full bathrooms with 2126 square fee of living space. The spacious master suite is designed with an ensuite bathroom, spa tub, walk-in closet, and a separate retreat that can be used as an office or nursery. The unique design element of the garden window brightens the kitchen making it a hub for culinary family activity and is equip with stainless steel appliances, and granite counter tops. Adjoining on either side of the kitchen is the living, dining, and family rooms creating a spacious open floor plan. A double-sided fireplace i
This spacious home located at 523 W Chaparral St, Rialto, CA 92376 offers ample living space with a total lot size of 8400 square feet and a living area of 1281 square feet. The property features a large kitchen, a spacious living room, and a dining area, providing plenty of room for gatherings and relaxation. With three bedrooms and two bathrooms, there's enough space for the whole family. Additionally, the property includes a convenient two-car garage for parking. Enjoy outdoor living with a backyard featuring a patio cover, perfect for outdoor entertaining, as well as a well-maintained front yard. This home provides both comfort and functionality for modern living.
For sale: Discover spacious and affordable living in this spectacular mobile home that offers the perfect blend of comfort and convenience. As you step inside, you'll be greeted by a large, open family room that seamlessly flows into a generously sized, open-concept kitchen equipped with a movable island, providing the ideal space for cooking and entertaining. This home boasts large bedrooms, including a master bedroom complemented by a spacious bathroom, ensuring a private retreat for relaxation. An additional bonus room offers flexible space for your unique needs, whether it's an office, playroom, or hobby area. The extra-large laundry room adds to the convenience, providing ample space f
$20K PRICE REDUCTION!! Nestled in a charming neighborhood of North Rialto, 762 N Mulberry Ave offers an exceptional blend of comfort, style, and convenience. This meticulously maintained single-family home exudes warmth and character at every turn, inviting you to indulge in a lifestyle of ease and enjoyment. This immense residence features 4 bedrooms and 2 bathrooms, providing ample space for families or individuals. The well-designed floor plan offers a seamless flow between the living spaces, creating an inviting atmosphere for relaxation and entertainment. Step inside to discover a bright and airy interior with new wood flooring and large windows and doors. The spacious kitchen is perfe
This area's enrollment policy is not based solely on geography. Please check the school district website for more information.
Elementary schools
Middle schools
High schools
GreatSchools Summary Rating
7/10
Samuel W. Simpson Elementary School
Public, K-5
6/10
Ruth Grimes Elementary School
Public, K-6
6/10
Trapp Elementary School
Public, K-5
6/10
Mary B. Lewis Elementary School
Public, K-6
6/10
Dolores Huerta International Academy
Public, K-6 • Choice school
Only showing 5 of
39 elementary schools.
School data is provided by GreatSchools, a nonprofit organization. Redfin recommends buyers and renters use GreatSchools information and ratings as a first step, and conduct their own investigation to determine their desired schools or school districts, including by contacting and visiting the schools themselves.Redfin does not endorse or guarantee this information. School service boundaries are intended to be used as a reference only; they may change and are not guaranteed to be accurate. To verify school enrollment eligibility, contact the school district directly.
Homes for sale in Rialto have a median listing price of $576K. Some of these homes are Hot Homes, meaning they're likely to sell quickly.
What are some of the most popular neighborhoods in Rialto?
Popular neighborhoods include West Colton, Las Colinas, North Fontana, Polo Trace, Ward 1, Downtown Fontana, Ward 5, Sierra Lakes, Northwest San Bernardino, and Rancho Fontana.
How often does Redfin update their new listings?
Most of our new listings in Rialto are updated every 5 minutes so you can see new homes as soon as they come on the market. Learn more
What is transportation like in Rialto?
Rialto, California boasts a robust transportation system with a variety of options for residents. The city experiences moderate traffic levels, making driving by car a viable mode of transportation. Public transportation is available in Rialto, offering an alternative to those who prefer not to drive. Additionally, Rialto is conveniently located near several major highways and freeways, providing easy access to surrounding regions. Learn more on our Rialto city guide.
What types of properties are available in Rialto?
Rialto, California offers a variety of single-family home types, including ranch-style, contemporary, and modern designs, each with their own unique features and architectural styles. These homes can be found throughout the city, in neighborhoods such as North Rialto, Las Colinas, and Bloomington. Most properties in Rialto, California feature 3-5 bedrooms and were built within the past 20 years. To explore different property types for sale in Rialto, California, use the 'Home type' filter located above the active listings. Customize your search by selecting options like single-family homes, condos, townhomes, and more.
What is life like in Rialto?
Rialto, California offers a unique living experience with its diverse range of neighborhoods and housing options. The landscape is characterized by a mix of urban and suburban areas, with a variety of parks and green spaces scattered throughout the city. The weather in Rialto is typically warm and sunny, making it ideal for outdoor activities and enjoying the local amenities. Job opportunities are abundant in various industries, including healthcare, manufacturing, and logistics, providing residents with a wide range of employment options. There are plenty of recreational activities to partake in, such as exploring local trails, visiting community centers, and participating in sports leagues.
What are the schools and amenities like in Rialto?
Rialto, California, is a vibrant city with a variety of public amenities to enhance your lifestyle. The city boasts numerous restaurants offering a range of cuisines to satisfy your culinary cravings. For those who enjoy outdoor activities, there are several parks available for recreational use. Grocery stores are conveniently located throughout the city, ensuring easy access to your daily necessities. Additionally, Rialto offers other amenities such as libraries, fitness centers, and shopping centers, all contributing to a comfortable and convenient living experience.
In the past month, 50 homes have been sold in Rialto. In addition to houses in Rialto, there were also 11 condos, 1 townhouse, and 3 multi-family units for sale in Rialto last month. Rialto is a minimally walkable city in San Bernardino County with a Walk Score of 41. Rialto is home to approximately 99,462 people and 18,551 jobs. Find your dream home in Rialto using the tools above. Use filters to narrow your search by price, square feet, beds, and baths to find homes that fit your criteria. Our top-rated real estate agents in Rialto are local experts and are ready to answer your questions about properties, neighborhoods, schools, and the newest listings for sale in Rialto. Our Rialto real estate stats and trends will give you more information about home buying and selling trends in Rialto. If you're looking to sell your home in the Rialto area, our listing agents can help you get the best price. Redfin is redefining real estate and the home buying process in Rialto with industry-leading technology, full-service agents, and lower fees that provide a better value for Redfin buyers and sellers.
 REDFIN IS COMMITTED TO AND ABIDES BY THE FAIR HOUSING ACT AND EQUAL OPPORTUNITY ACT. READ REDFIN'S FAIR HOUSING POLICY AND THE NEW YORK STATE FAIR HOUSING NOTICE.
 United States
 Canada