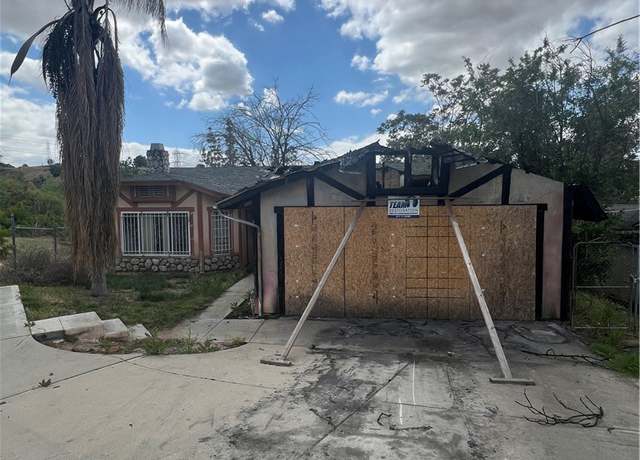
This is a fire damaged single family property. THREE BEDROOMS, TWO BATHROOMS, TWO CAR GARAGE, AND 1642 FT. ² OF LIVING SPACE. Only non-contingent cash offers will be considered. The vacant lot to the left of subject inmediately next to it is not part of the property.
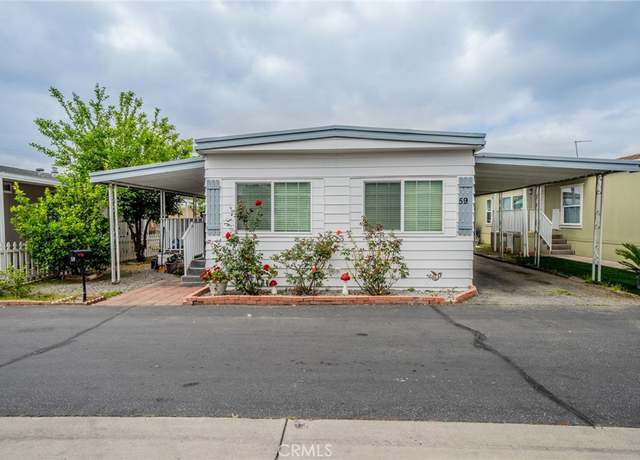
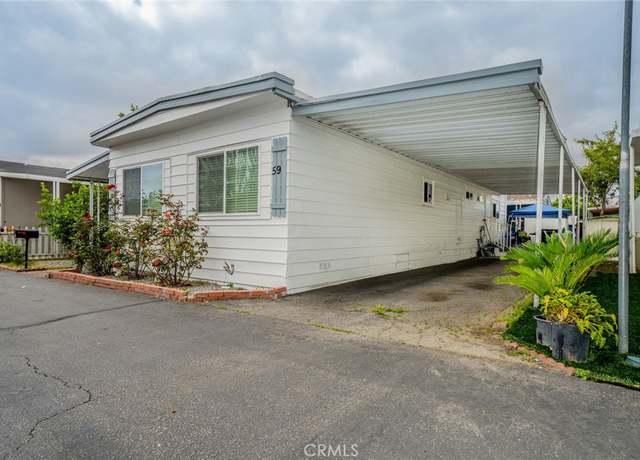
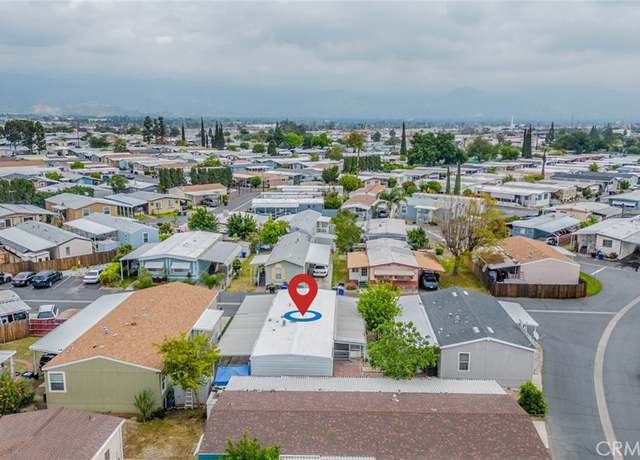
Check out this charming mobile home! This community offers a clubhouse, children's park, and community pool & Spa. The inside of the house opens to a spacious living room that adjoins the dining room and kitchen, with plenty of natural sun from nice-sized windows. This home features 3 bedrooms and 2 bathrooms—new laminate flooring. The attached carport can fit up to 3 cars. It is close to shopping, schools, and parks. Come to see this beauty before it's gone.
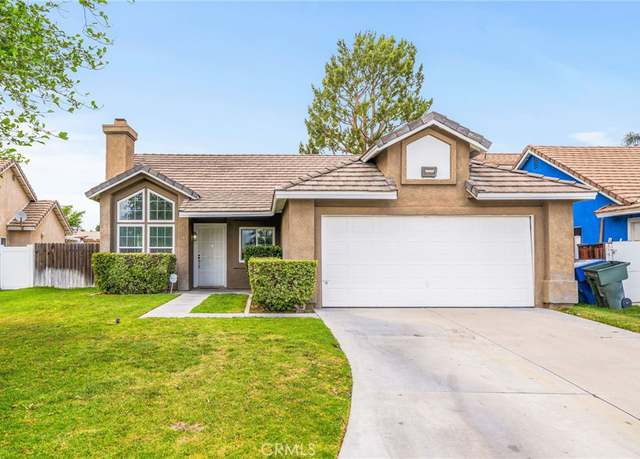
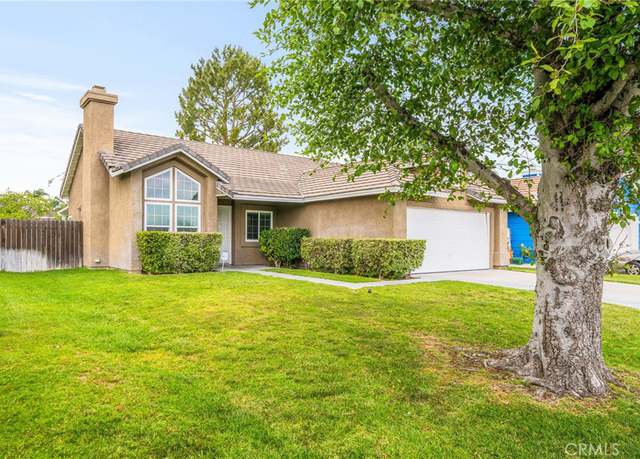
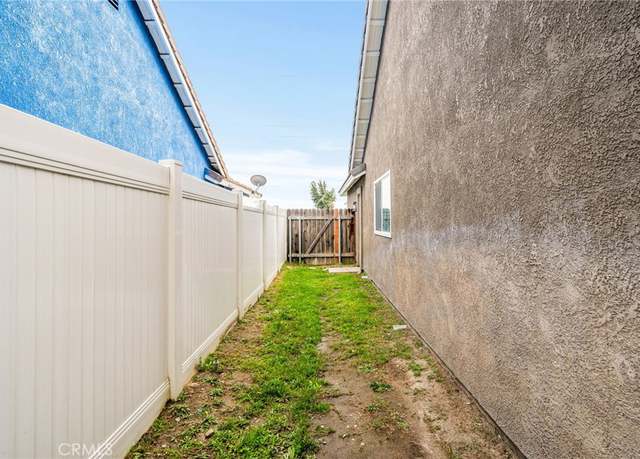
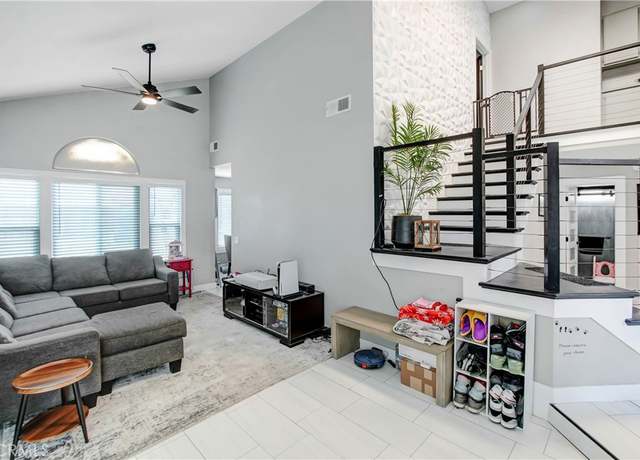
Welcome to your dream home! This beautifully remodeled 3-bedroom, 2-bath residence is located in a great neighborhood, offering the best of both worlds in terms of convenience and charm. Step inside to discover a modern interior that boasts fresh paint throughout, upgraded flooring, and stylish new light fixtures that create a warm inviting ambiance. The spacious living areas are perfect for entertaining or relaxing with family and friends. The kitchen has been updated with new appliances, providing you with all the tools you need to prepare delicious meals. Both bathrooms have been tastefully renovated, featuring new vanities and fixtures for a touch of luxury. Outside, you'll find a great
Nestled in the prestigious hills of Reche Canyon, this impeccably upgraded two-story residence exudes sophistication and elegance. Featuring a formal living room, dining room, and a spacious family room with a stylish with new marble fireplace, this home is ideal for luxurious entertaining. The kitchen was extended and full remodeled with high-end modern upgrades. Every inch of this home has been meticulously enhanced with over $100k invested in renovations within the last year, including new low-e windows, custom entry and exterior doors (upgraded to keep out sounds), fresh paint inside and new exterior 2 tone paint outside, plus new tile flooring throughout. The remodeled bathrooms have e
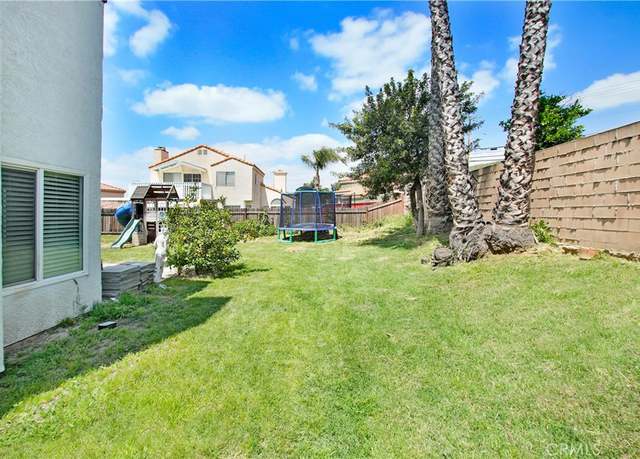
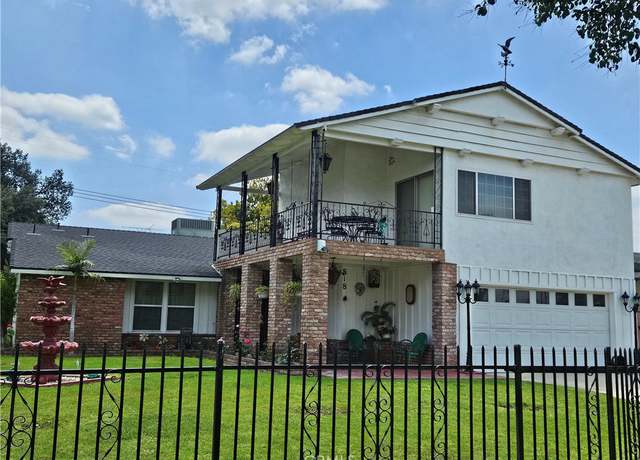
WELCOME TO 818 LOUISE!! THIS BEAUTIFUL TWO STORY HOME OFFERS CUSTOM BRICK WORK, A 2 CAR GARAGE WITH A SMALL WORKSHOP AND A POOL ON A CORNER LOT!! NESTLED IN A QUITE FAMILY NEIGHBORHOOD CLOSE TO SCHOOLS AND IS MOVE IN READY. THIS HOME FEATURES 4 BEDROOMS AND 3 BATH ROOMS, 2 FIREPLACES, 1,862 SQ FT WITH A 400+ SQ FT ADDITION AND A LARGE BALCONY ON A 8,625 SF LOT. SOME OF THE MANY FEATURES ARE, DUAL PANE WINDOWS, UPDATED KITCHEN, NEW ROOF, NEW AIR CONDITIONER, NEW 50 GALLON WATER HEATER, PLAY HOUSE, KOI POND, ORANGE TREE, LARGE FENCED FRONT AND BACK YARD WITH PLENTY OF ROOM FOR THE KIDS TO PLAY AND TO ENTERTAIN FAMILY & FRIENDS. CALL OR TEXT TO MAKE AN APPOINTMENT TO VIEW TODAY!
Welcome to your newly remodeled home in the vibrant community of Colton, CA. This property has undergone extensive updates, featuring new flooring, fresh paint, top-of-the-line appliances, and energy-efficient windows for a stylish and comfortable living environment. Conveniently located close to shopping centers and just minutes from the 10 Freeway, this home provides seamless access to daily conveniences and easy commuting options. It's perfectly situated for quick trips to local amenities and beyond. Inside, you'll find a thoughtfully designed space that maximizes both style and functionality, including a versatile bonus room. This additional space is ideal for a home office, playroom, o
Inviting 2-bedroom, 1-bathroom home on 0.42 acres, featuring 912 sqft of living space and a basement. Conveniently situated just minutes away from the 10 hwy.
Reche Canyon View home! Secluded and Private. This home features entrance to living room, kitchen/dining room combo w/ fireplace, 3 spacious bedrooms, 3 full baths, family room w/ fireplace, washer/dryer area, enclosed sun room and a garden. Need a concrete block garage with a workshop, RV parking, ample space for all your vehicles and outdoor toys?All is accessed by a private road leading to your new home: offering plenty of parking privacy and peace. This property has one propane tank(owned), a well and septic system. Personalize this home as you see fit. It's potential is undeniable presenting a fantastic opportunity for those looking to customize their dream home. All this is nestled i
* * * PERMITTED 1 BEDROOM, 1 BATH DETACHED LIVING QUARTERS TO REAR OF MAIN HOUSE (789SQ/FT) Plus Car Port and 2 car Garage * * * Main house is 3Bdrm/2Ba. and has many permitted structural upgrades, ie; a 5 ton-main house/3 ton-ADU recently installed NEW AIR CONDITIONING UNITS, whole house fan in ADU, Solar Panels for lower electric bill, Custom, Master Walk-In Shower, recessed lighting, replacement from plaster to drywall, rewiring of entire house, house wired for house speaker system and home security system, upgraded earthquake retrofit, sound proof and sound absorbing wall insulation. .. Large Covered Patio with cement flooring for family/friends gatherings and still room for
Welcome to Grand Terrace, your new home awaits! This charming 3 bedroom, 2.5 bath home has all that a growing family could ask for and more. The moment you walk through the door you will be impressed with its welcoming entry area that leads to an oversized living room with a cozy fireplace and formal dining room. The kitchen has been updated with newer granite counter tops, tile back splash and lots of kitchen cabinets. The kitchen has a coffee bar area and a breakfast island! A master bedroom that provides direct access to the back yard, a remodeled master bath along with two large guest bedrooms and a full bath are on the west wing of the house. On the east wing of the home, you have a l
Welcome to Vista Grande Way! This home is located in a unique area of the highly sought after community of Grand Terrace. This rare home provides spectacular and unobstructed panoramic views as far as the eyes can see. In fact, the views from this home might be the best in the neighborhood. The 3 bedroom and two full bath home spans across nearly 2250 square feet. On the north wing of the home, you will find a private oversized master suite with a walk-in closet and full bath that includes a standalone shower and a soaking tub. The two guest bedrooms and full bath are located on the south wing of the home. The large open concept design of the kitchen, dining area and living room will leave
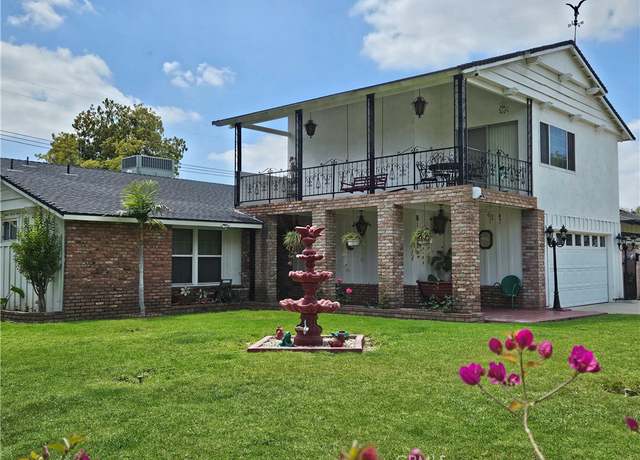
Two on a lot horse property- Horse family dreams and memories are made here! If you're a beloved horse owner take it from another beloved horse owner this property offers what we desire. In my opinion the mare motel alone is worth its weight in gold with 9 oversize 24x24 stalls. As for you (the new owner) the main adobe house was built to last with high quality upgrades throughout, including a newly renovated kitchen boasting state of the art stainless appliances, custom cabinetry W/ soft touch pull out drawers and tons of storage. Beautiful 36" stainless commercial stove/oven, under cabinet lighting, oversized island W/ USB ports and more. Did I mention the beautiful stainless farm si
Welcome to 1254 Norman Road in Colton! This exceptional single-family home boasts 3 bedrooms and 2 bathrooms spread across 1,692 square feet of living space on a generous 8,280 square foot lot. As you enter, you'll immediately appreciate the thoughtfully designed floorplan, abundant natural light, and beautiful wood floors that create a warm and inviting atmosphere. The living room is spacious, airy, and features a cozy fireplace, perfect for gatherings with loved ones. Adjacent to the living room lies the kitchen and dining area, where modern appliances, elegant white cabinetry, and ample storage and counter space await, making meal preparation a breeze. The home comprises three well-propo
Welcome to your dream home! Nestled in the sought-after La Cadena Creek Mobile Home Park in Colton, this spacious, remodeled gem offers the perfect blend of affordability and style. Step into an inviting open concept layout boasting 3 bedrooms including a master suite with walk in closet, 2 bathrooms, and ample living spaces including a family room/ living room, and a dining area ideal for entertaining. But that's not all – this unit stands out with one of the largest lot sizes and backyards in the entire community, providing plenty of outdoor space. Enjoy the convenience of a separate laundry room and an attached 2-car carport, ensuring both comfort and practicality. The property was
GREAT LOCATION . TURN KEY. READY TO MOVE. Exclusive opportunity to buy a home few minutes away from LOMA LINNDA Hospital with Fully PAID OFF 28 PANELS SOLAR. This 5 bedroom home on almost 9000 sq ft lot , in a quiet and gentle neighborhood. This home has a main floor one room (Third car garage is Tandem and converted to a bedroom) can be used as bedroom or office Studio/ in-Law suite or room for your personal gym. Highly upgraded kitchen with granite counter tops and big island. Car Garage very well maintained and upgraded and can be easily converted to an ADU. You will find Everything that you want in a Luxury home at Lowest price in the area. Huge back yard with excellent landscaping.
New New New! Welcome Home To This Amazingly Remodeled Down Stairs Home In Cooley Ranch! This Is A Must See! Everything has been Remodeled From Top To Bottom, New Kitchen, New Dual Pane Windows, New Upgraded Argon Gas Dual Pane Sliding Glass Door, Remodeled Bathrooms, And Bedrooms. You will absolutely love this Move In Ready Turn Key Home! It Even Has It?s Own Private Gated Yard And In Unit Laundry! The Beautiful Gated Community of Country Woods offers Lush Landscaped areas throughout, A Dedicated Covered Parking Spot, Ample Guest Parking And A Pool And Spa! It Is Centrally Located Close To All Amenities and minutes aways from the 215/10/210 & 60 Freeways While Still Being Located
Seller will reply within 48 hrs. Enjoy this newly remodeled 3 bedrooms 2 bath HOME of your DREAMS. This Beautifully Quiet Neighborhood neat to Woodrow Wilson Elementary School. Home with new upgrades any homeowner would LOVE!!! Starting with a NEW Kitchen with its new cabinets and countertops along with beautiful open space anyone would love. Newer dual pane energy efficient windows, New Exterior paint, New Interior paint, New upgraded laminade floors, Newly remodeled bathrooms, New light fixtures, New plumbing fixtures. This comes along with its great sized cover patio perfect for entertaining your guests. This home has so much to offer for any size of a family looking to find a beautiful
Welcome to this private ranch property, a newly constructed oasis completed in 2024. Nestled on over 6 acres of land, this unique estate features a distinctive U-shaped layout, embracing a serene courtyard at its core. Within this picturesque setting, you'll discover two distinct residences. The main house offering 5 bedrooms and 4 bathrooms, providing ample space for comfortable living and entertaining. Separate to the main residence is a charming back house also known as a casita / ADU / agricultural house , boasting 4 bedrooms and 2 bathrooms, spanning approximately 1456 square feet. Outside, the expansive grounds offer endless possibilities, whether you dream of parking your RV or boat,
Welcome to this Beautiful Hidden Gem located inside of this Family Oriented Gated Community in Colton Ca. This charming 3bd 2ba home exudes elegance and comfort with an open floor plan, high ceilings, and wood flooring. This spacious kitchen has ample cabinet and countertop space with a very modern appeal. The kitchen overlooks the Living Room which is great for open conversation with family or guests. Inside the spacious living room there's a beautiful electric fireplace for cozy evenings. Adjoining the living room is a cozy family dining area connected to a small sunroom. Inside the meticulously cared for home are 3 bedrooms that provide a space for comfort and tranquility and 2 full bath
The Lapis floor plan opens with a Study room, perfect for office, hobbies or formal dining area. At the back of the home, you'll find a dining area, a great room, and a kitchen with a center island and access to the backyard. Open stair railing will lead you to the second floor where you will find the owner's suite which includes a walk-in closet and an attached bathroom. Upstairs also features a laundry area, two bedrooms and a bathroom with double sinks, as well as a loft. Options included: double sink in 2nd bath too, pre-plumb in laundry room for sink, wood railing stairs to second floor, additional windows at Great Room, 42" upper cabs and hardware upgrade, cultured marble counter
Excellent first time buyer opportunity and or investment property with two bedrooms and two full baths. It is a highly sought after first floor, bottom unit with a direct access, attached, one car garage, in addition, there is another assigned parking space outside in front of the unit. The condo has tile flooring and new carpet in bedrooms. Kitchen and Bathrooms are newly remodeled and have new white cabinetry and new countertops, plus appliances including attached microwave. The Central heating and air system & electrical box are newer and updated as well. There is an in-unit stackable washer and dryer area located inside the hallway closet. Some of the other featured upgrades are s
The perfect spot for the nature lover with plenty of room for horses and other pets. This 3 beds 2 baths with 3+ levels on the property is unique and full of possibilities. The manufactured home is nestled along side the foothills with amazing views. The stone drive way leading to the front entrance of the home expands along side the home shoring up the various levels. Rose bushes were planted throughout the property adding beauty, color and fragrance. For added features, there are two small structures perfect for use as an art studio, office or short term living space for visitors. Current steel framing on the property is used for excess warehouse storage, and can be removed at any time by
Don't miss out on this fantastic opportunity in the heart of Colton! This 4-bedroom, 2-bathroom residential home is awaiting your personal. Situated on a spacious lot with a convenient tool shed in the back, this property offers plenty of room for expansion and customization. Nestled in a corner lot, you'll appreciate the ample front and back yards, providing endless possibilities for landscaping and outdoor enjoyment. Located in a vibrant community, you'll enjoy the convenience of being close to schools, shopping centers, and other amenities. Bring your vision and creativity to transform this home and make it yours.
Welcome to your newly remodeled sanctuary in the heart of a gated community! This charming upstairs unit boasts modern elegance and convenience, featuring 1 bedroom and 1 bathroom. Step inside to discover a thoughtfully redesigned living space, where every detail has been carefully curated for your comfort. The open floor plan seamlessly connects the living area to the updated kitchen, creating an inviting atmosphere for relaxation and entertaining. As a resident, you'll enjoy exclusive access to not one, but two sparkling pools, offering a refreshing retreat on sunny days. Whether you're looking to take a leisurely swim or simply soak up the sun, these resort-style amenities are sure to de
Beautiful remodeled 2 bedroom 2 bath one level condo. This amazing downstairs unit is located in the Country Wood gated community. This complex is very centrally located close to amenities and the 215/10/210/60 freeways. Just minutes to Loma Linda Hospital. A beautiful unit tucked away in the center of the complex offering nicely landscaped grounds, dedicated covered carport and ample parking throughout the community. This unit offers a private entrance, large living room with sliding door to your own private patio/gated yard, 2 large bedrooms, individual indoor laundry closet, 2 large bathrooms, walk-in closet in the Master bedroom, picturesque windows throughout to let in lots of natural
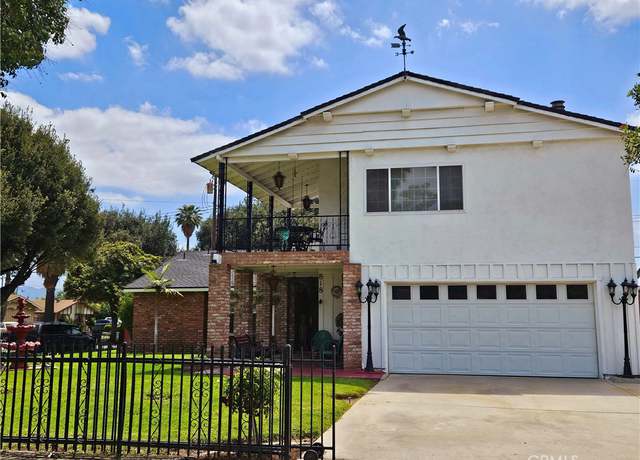
Great opportunity for one lucky buyer to own this move-in ready home in Colton. Fresh interior paint just completed. This home boasts a great floor plan with lots of natural light, 5 bedrooms, 3 full bathrooms, a living room/dining room combo, a separate family room with a fireplace, a loft, a 2-car garage, and a balcony off the master bedroom to enjoy your coffee while gazing at the mountain views. The kitchen boasts granite counters, stainless steel appliances, and white cabinets. This low maintenance 2012 built home offers stucco exterior, tile roof, and landscaped front and backyards. There is a bedroom and full bathroom on the first floor. Located close to schools, parks, shopping, fre
Welcome to Quiet, Rural Reche Canyon. This stunning residence combines comfort, style, and convenience - just 7 minutes from Loma Linda University and Medical Center. This remarkable home offers almost 2600 square feet of spaciousness and comfort. Boasting five bedrooms and four well-appointed bathrooms, this property ensures ample space for both relaxation and entertainment. The inclusion of a first floor bedroom/bathroom combo with a separate entrance adds a versatile option for guests or extended family, providing privacy and comfort. The heart of the home features a Remodeled Kitchen with Quartz Countertops, Stainless Steel Appliances, a farm sink, Shaker style Cabinets and a Breakfast
Welcome to this beautiful home nestled in the heart of Colton! Offering a stunning array of updates, this residence offers a perfect blend of modern style and comfort. Step inside to discover all-new paint and luxurious vinyl plank floors that create a warm and inviting atmosphere throughout. The home features new windows that flood each room with natural light, illuminating the beautiful all-white kitchen—a true centerpiece of the home. The bathroom has undergone a complete makeover, showcasing a new tub, tile, vanity, and upgraded lighting fixtures and ceiling fans. Situated on a spacious 7,200 square foot lot, the backyard offers ample space for gardening, entertaining, or simply e
Remodeled single story home in Colton. White kitchen cabinets with quartz counter tops, recessed lighting and backsplash. Tile floors throughout and carpet in bedrooms. Indoor laundry. Appliances. Two car detached garage. Spacious front and back yard. Lovely neighborhood. Quick move in.
Welcome to this stunning three-bedroom, two-bathroom home in the desirable city of Colton! This property is conveniently located near elementary and junior high schools, as well as hospitals, making it the perfect location for families. The home has been meticulously cared for and boasts strong bones, ensuring durability for years to come. If you're searching for a peaceful and quiet neighborhood, look no further - this is the one for you. With a spacious layout and modern touches throughout, this home is ready for you to move in and make it your own. Don't miss out on the opportunity to own this lovely property in a prime location.
Horse Ranch Property with over an acre of land. LOTE MUY GRANDE- MAS DE UN ACRE. Board horses, raise livestock plus many other possible uses. Original owner- Home is 3 bedrooms, 2 baths, 1350 sqft. 2 car garage has been split into a workshop and possible 4th bedroom. Pool & spa, covered patio. Other features include: Roof mounted central AC, granite kitchen counters, fruit orchard in rear including: Orange tree, Blood Orange, Lime, Guava, Tangerine, red & pink pomegranate trees, loquats, cumquat, 2 huge macadamia nut trees, Lemon Tree, huge white berry tree in rear plus 2 avocado trees. Value in land. Water district offered to purchase property to store trucks. Suggested uses bu
Built in 2021 single-family house nestled in a serene single-family community with parks, just 10 minutes drive distance from UC Riverside. This exquisite 5-bedroom, 3-bathroom masterpiece awaits you. This home offers modern luxury and comfort in abundance. As you step inside, you'll be greeted by a grand living area, and a Downstairs bedroom with a full bath. It has a spacious kitchen boasts modern appliances and the individual pantry fits groceries from your Costco shopping and more! Upstairs, the primary suite with a window that overlooks the stunning mountain views, 3 bedrooms, and an additional family room offers ample space for relaxation and slumber. For vehicles, it has 3-car garage
Massive price improvement! Fixer deal of the century! Massive lot with 2 homes on 1 lot! County land use shows multifamily single-family residences of 5 to 14 units!! Centrally located in a gorgeous neighborhood! Seller already has plans pending approval from the city to build with existing dwellings to make 2 single-family residences of 2 bedrooms 1 bath each with more than 1000 sqft! Both homes each have their driveways and mailbox! Whether you are going with the seller's plans or doing a complete build-out, this is perfect for any buyer or investor with massive upside! Located just minutes from San Bernardino Valley College, Macy's, H & M, Forever 21, Orange Show Speedway, Tes
Welcome to Colton , Amazing opportunity Zoned Residential on Commercial this home offers 3 bedrooms and one bath. Conveniently located on a main street right off the 10fwy, which is perfect to own your home and business on the same LOT . This home has a private alley entrance perfect for multiple cars or potentially building an ADU . This propety is a "must see" ! Don't miss out.
Welcome to this charming 3-bedroom home located in the heart of Rialto. Offering versatility and ample space for your family's needs, this property features a bonus room that can easily be used as a fourth bedroom. Take advantage of the low community fee and access to the playground, clubhouse, and pool. The large, fenced backyard and two-car garage provide convenience and outdoor enjoyment. Don't miss this fantastic chance to own a 3-bedroom home in Rialto. Schedule your viewing today and discover the best of this thriving community. Disclosure: Buyers to satisfy themselves with the condition of the property.
This area's enrollment policy is not based solely on geography. Please check the school district website for more information.
Elementary schools
Middle schools
High schools
GreatSchools Summary Rating
6/10
Georgia Morris Elementary School
Public, K-6
5/10
Cooley Ranch Elementary School
Public, K-6
5/10
Ernest Garcia Elementary School
Public, K-5
5/10
Terrace View Elementary School
Public, K-6
5/10
Woodrow Wilson Elementary School
Public, K-6
Only showing 5 of
17 elementary schools.
School data is provided by GreatSchools, a nonprofit organization. Redfin recommends buyers and renters use GreatSchools information and ratings as a first step, and conduct their own investigation to determine their desired schools or school districts, including by contacting and visiting the schools themselves.Redfin does not endorse or guarantee this information. School service boundaries are intended to be used as a reference only; they may change and are not guaranteed to be accurate. To verify school enrollment eligibility, contact the school district directly.
Homes for sale in Colton have a median listing price of $479K. Some of these homes are Hot Homes, meaning they're likely to sell quickly.
What are some of the most popular neighborhoods in Colton?
Popular neighborhoods include West Colton, Polo Trace, Cooley Ranch, Valley View, Ward 1, Ward 3, Southwest San Bernardino, Reche Canyon, East Colton Heights, and Lytle Creek.
How often does Redfin update their new listings?
Most of our new listings in Colton are updated every 5 minutes so you can see new homes as soon as they come on the market. Learn more
What is transportation like in Colton?
Colton, California is well-connected with a variety of transportation options, making it easy for residents to navigate the city by car. It boasts a comprehensive public transportation system, including buses and trains, providing reliable and convenient travel options. Traffic levels can vary, but generally, driving in Colton is relatively smooth with less congestion compared to larger cities. Additionally, Colton is conveniently located near several major highways and freeways, such as Interstate 10 and Interstate 215, offering easy access to surrounding areas. Learn more on our Colton city guide.
What types of properties are available in Colton?
Colton, California offers a variety of single-family home types, including ranch-style, contemporary, and modern designs, with options ranging from 2 to 5 bedrooms and varying year built. To explore different property types for sale in Colton, California, use the 'Home type' filter located above the active listings. Customize your search by selecting options like single-family homes, condos, townhomes, and more.
What is life like in Colton?
Colton, California offers a unique living experience with its diverse range of landscapes, from rolling hills to urban areas. The weather in Colton is typically warm and sunny, creating an inviting atmosphere for outdoor activities. The city provides a variety of job opportunities across different industries, ensuring residents have options for employment. Colton also boasts a vibrant social scene, with numerous recreational activities and events to participate in. Whether it's exploring local parks, engaging in community events, or enjoying the city's dining and entertainment options, there is always something to do in Colton.
What are the schools and amenities like in Colton?
Colton, California offers a variety of public amenities to cater to the lifestyle needs of its residents. The city boasts numerous restaurants, offering a diverse range of cuisines to satisfy all culinary preferences. Outdoor enthusiasts will appreciate the well-maintained parks that provide ample space for leisure and relaxation. For everyday needs, there are several grocery stores throughout the city, ensuring convenient access to fresh produce and other essentials. Additionally, more amenities such as fitness centers, libraries, and shopping centers are available, making Colton a city equipped with a comprehensive range of facilities.
In the past month, 16 homes have been sold in Colton. In addition to houses in Colton, there were also 22 condos, 3 townhouses, and 5 multi-family units for sale in Colton last month. Colton is a minimally walkable city in San Bernardino County with a Walk Score of 43. Colton is home to approximately 51,458 people and 14,447 jobs. Find your dream home in Colton using the tools above. Use filters to narrow your search by price, square feet, beds, and baths to find homes that fit your criteria. Our top-rated real estate agents in Colton are local experts and are ready to answer your questions about properties, neighborhoods, schools, and the newest listings for sale in Colton. Our Colton real estate stats and trends will give you more information about home buying and selling trends in Colton. If you're looking to sell your home in the Colton area, our listing agents can help you get the best price. Redfin is redefining real estate and the home buying process in Colton with industry-leading technology, full-service agents, and lower fees that provide a better value for Redfin buyers and sellers.


 REDFIN IS COMMITTED TO AND ABIDES BY THE FAIR HOUSING ACT AND EQUAL OPPORTUNITY ACT. READ REDFIN'S FAIR HOUSING POLICY AND THE NEW YORK STATE FAIR HOUSING NOTICE.
 United States
 Canada