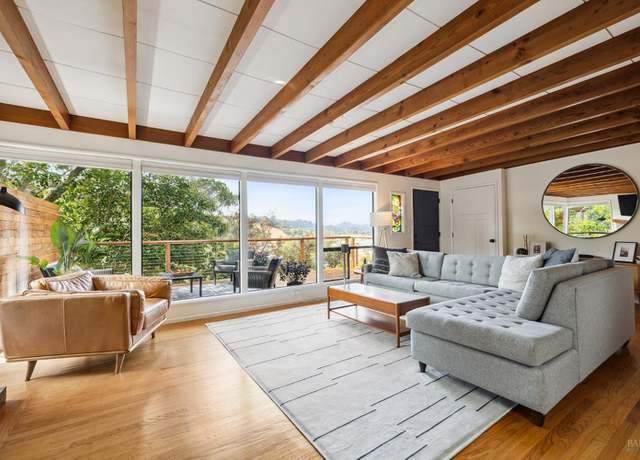
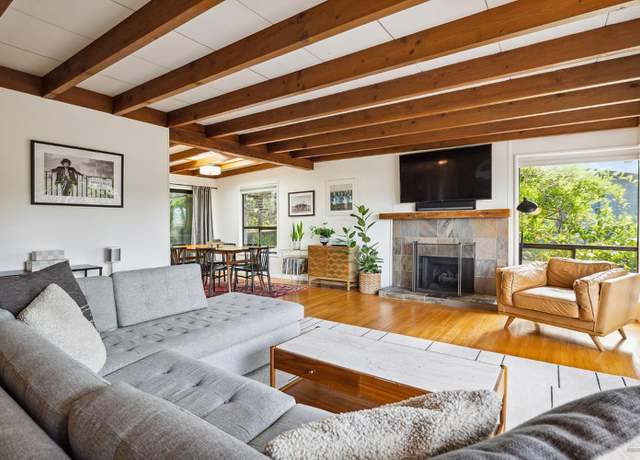
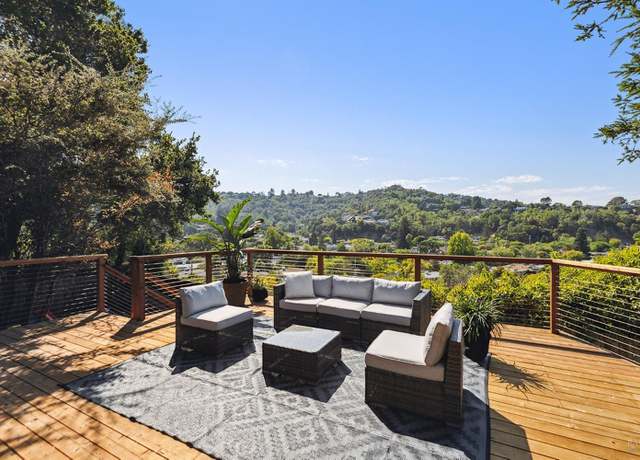
This gorgeous mid-century home is positioned on nearly 11,000 sq. ft. lot (per tax records) showcasing sweeping views of rolling hills, mature trees, lovely landscaping, and over 800 sq. ft. of deck space (per graphic artist). Spacious interior spans 1,976 sq. ft. on two levels (per graphic artist) offering the perfect blend of modern luxury w/ vintage charm. The open living room enjoys abundant natural light, wood beamed ceilings, gas fireplace w/ stone surround, entertainment layout open to the dining area, and hardwood flooring throughout. Updated kitchen includes full suite of new appliances, wine fridge, built-in office space, and plentiful storage. Featuring custom built-in for full s
Lovely lower 1BD with den unit. The den can easily be converted into a 2BD. LVP flooring grace the unit. Freshly painted throughout. This unit has a sunroom as well. New linoleum has been added. Dual pane windows throughout. There are granite countertops, dishwasher, newer range, front loader washer in kitchen and dryer in sunroom. Tile in the bathroom with newer vanity, light fixture and toilet. Nicely landscaped back patio with brick walkway and irrigation. Excellent school district, Mary Silveria. A must see!
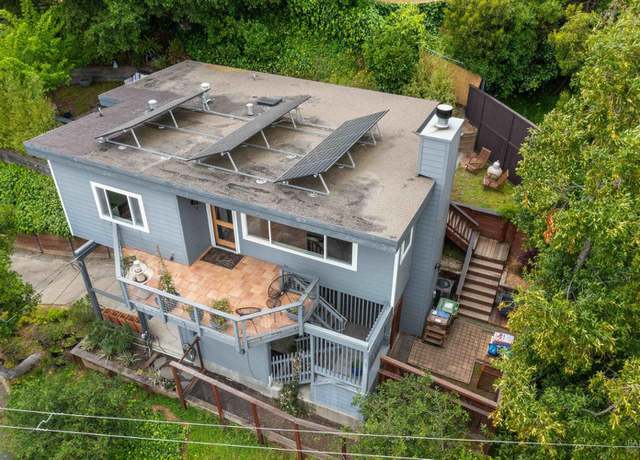
Ready to settle into your secluded, energy efficient, hideaway in beautiful Gerstle Park? This move-in ready gem boasts phenomenal views of the Bay from the landscaped, level side yard and inviting front deck. The outdoor spaces are nestled in trees and include a bocce ball court and a plumbed NG fire pit for a delightful, private entertainment space. Inside, the open beam ceilings, duel-fuel fireplace and hardwood floors add to its charm and cozy sophistication. Large eat in kitchen with granite countertops, fully owned solar system, AC and loads of storage space make this a perfect place to call home. Off street parking for up to 4 cars and Sun Valley Elementary are added bonuses!
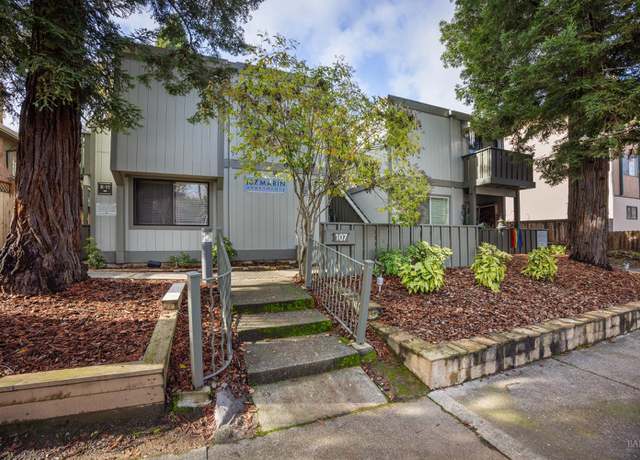
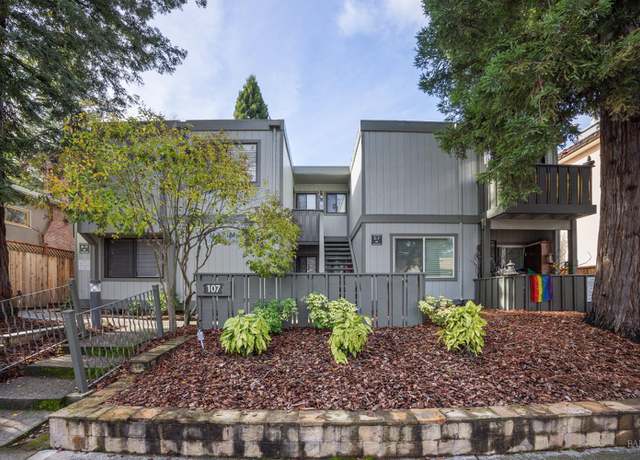
107 Marin St features a well-appointed 11-unit apartment building constructed in 1975. The unit mix consists of ten (10) 1-bedroom/1-bath units and one (1) 2-bedroom/1-bath unit. Units have en-suite bathrooms along with updated kitchens with granite countertops, newer cabinets, stainless steel appliances, built-in microwaves, dishwashers and electric stoves. Per the county assessor, the building area consists of 6,136 square feet, situated on a 11,250 square foot lot.
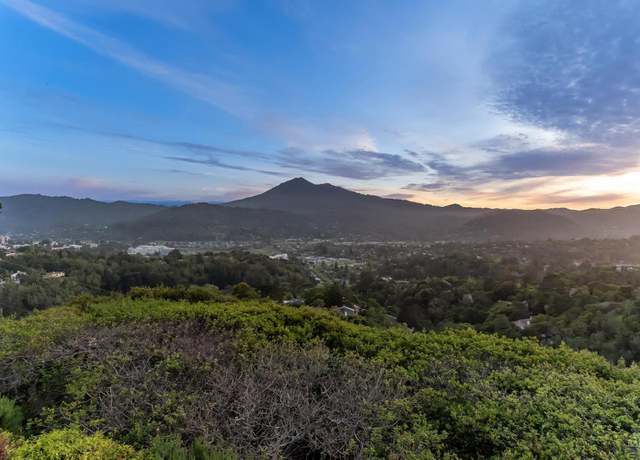
Expansive Mount Tam vistas dominate the backdrop of this stunning 4 bed, 3 bath plus office, home located on nearly 3/4 an acre. Designed to embrace the Marin landscape, most every window frames a breathtaking scene of the Bay, Mt. Tam or the surrounding hillsides. Offering the option for single level living to include a main level junior suite, & an open-concept design. Savor the captivating sunsets from the gourmet kitchen - a chef's dream & only steps from the covered outdoor dining space, perfect for entertaining. Ultra-private & bathed in natural light, this home seamlessly blends elegance & style with soaring ceilings, gorgeous wide plank flooring, designer bath
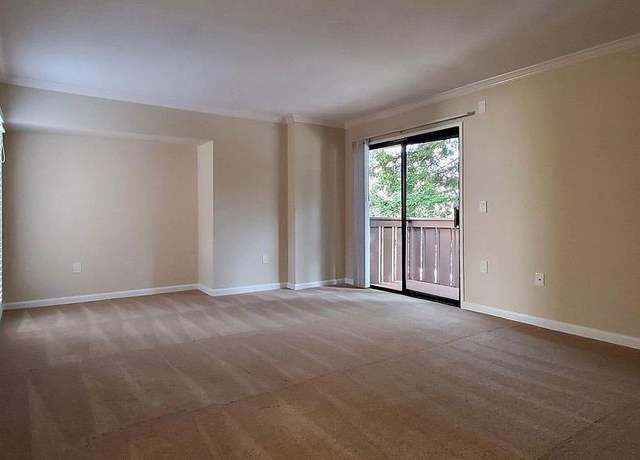
Discover the inviting and vibrant lifestyle at Villa Marin's Senior Community with this cozy, South-East facing 2-bedroom, 2-bathroom unit. Spanning 1030 sqft and featuring new carpet throughout, this residence offers comfort and convenience. The sunroom provides a bright, welcoming space, while the galley kitchen is fully equipped for culinary adventures. An in-unit washer/dryer enhances everyday practicality. Enjoy all the amenities and sense of community Villa Marin has to offer. The monthly HOA fee includes one chef-prepared meal per day (with more available at an extra charge), subsidized future medical care for Skilled Nursing or Assisted Living (exclusions may apply), housekeeping, a
Live Life To the Fullest at Smith Ranch 55+ Luxury Independent Living Community. This 1 bedroom 1 bathroom updated condo has a wonderful western facing view of greenery and redwood trees beyond that lets the light in while having a marvelous view. You will appreciate the newer carpet, fresh paint and built in cabinetry in the dining room for storage. The spacious living room with fireplace has easy access to the balcony to enjoy an afternoon beverage on and the full-size kitchen and large primary bedroom suite w/ walk in closet plus a stacked washer and dryer makes you feel like you have complete home. Feel safe and pampered with a 24 hour Security Call System, Weekly Housekeeping, 5 Star D
This is California Dreamin'! With abundant natural light, expansive interiors, and an inviting ambiance, this contemporary residence is nothing short of impressive. Breathtaking bay views from the gourmet kitchen and adjoining great room set the perfect backdrop for everyday living and entertaining. Step into a formal living room where vaulted ceilings, an elegant marble fireplace and custom bookcases add a touch of sophistication. The spacious primary suite, with open-beam ceilings, meticulously crafted built-ins and a spa-like bath, feels almost presidential. A separate lower level includes 3 additional bedrooms, a well-appointed bathroom, laundry room, and two expansive decks, ideal for
Atrium Model Eichler with enhanced upgrades throughout! Built on one of the most desirable lots in the neighborhood, nestled in a tranquil cu-de-sac with a backdrop of awe-inspiring hills. The open floor plan offers indoor-outdoor living with a sense of connection to the natural surroundings that make Upper Lucas Valley a nature lovers' paradise. The open living and dining rooms offer newly installed custom concrete floors, beam ceilings and wood burning fireplace with dramatic backyard views-perfect for entertaining large or small gatherings. The updated kitchen includes a large eat-in dining space, quartz countertops, skylight, and walk-in pantry. The family room is perfect for those cozy
Stunning one-level home on a large sunny corner lot in the coveted Dominican neighborhood. Tastefully remodeled inside and out, 327 Mountain View represents a unique blend of sophistication, convenience, curb appeal, and privacy. A modern entrance foyer welcomes you to a comfortable and logical single-level layout - three large bedrooms and two updated baths contained in one wing, and the expansive common areas + fourth bedroom/full bath that doubles as an in-law suite round out the opposite wing. The L-floorplan is designed for ideal indoor-outdoor flow with lush landscaping and gardens visible from every large window in every space. The backyard features a totally private oasis setting wi
Eichler Alert! 4B/2B home. Without question, the best value in Marin County!!!! Ready for immediate sale. Waiting for your updating touch to this home with all the classic details from the past. Clean and well-kept. Master Bathroom has been taken down to the studs. Lovely backyard area with perfect sun exposure. For the Eichler fan, this is your opportunity!!
Charming Picnic Valley Southern Heights Ridge with beautiful views! This cozy, unique home was built in 1961, lived in, and loved by long-time owners. This home served their family, spanning a lifetime of memories. 3 bedroom 1.5 bath located just minutes from downtown San Rafael's restaurants and shops, parks, schools, Highway 101 and 580, oversized . 34 acre lot. Enter this sun-filled original condition space to find a bright, open living room with a cozy fireplace, access to wrap-around decks, and a cozy kitchen. The main level features 2 spacious bedrooms with closet space and access to the beautiful view wraparound deck. Separated from the primary home, additional bedroom or office spac
This delightful 2BR/1BA home sits on an expansive 7,750 square foot lot, offering ample space for both relaxation and recreation. As you step inside, you're greeted by an abundance of natural light that fills this home, creating a warm and inviting atmosphere. Enjoy morning coffee or tea in the eat-in-kitchen. Venture outdoors to discover the landscaped terraced backyard, a tranquil oasis where you can unwind. One of the added conveniences of this home is the large laundry/bonus room below the main level, complete with its own entrance. This versatile space offers endless possibilities, whether you choose to use it as a home office, workout room, or cozy TV den. This home also has 2 dedicat
Beautiful country living on Lincoln Hill. Built in 1949, this charming, expanded bungalow is ideally sited on a spacious, corner, half-acre +/- lot. Mature oak trees dot the property and create privacy and a unique country setting. Living room with beam ceilings, fireplace, wood floors and picture windows. Heart-of-the-home classic kitchen with O'Keefe & Merritt oven/cooktop and ample cabinetry. Large east facing windows that fill the rooms with natural light. The three * bedroom one bathroom floor plan (third room does not have a closet) opens to generous outdoor living and mature gardens. The downstairs studio space offers generous room for expansion with French doors opening to th
Exceptionally rare custom-built, waterfront property w/ unbeatable views! As you walk through the grand entrance prepare to be captivated by the sheer magnificence of the towering ceilings soaring above the dual-sided staircase. The many living spaces of this sun-filled home flow seamlessly from one room to the next providing the perfect setting for both intimate gatherings or lavish entertaining. Your dream kitchen awaits w/ all new appliances, new Quartz countertops & Butler's pantry. Allow yourself daily retreat in the luxurious primary suite, where relaxation is paramount. Pamper yourself in the spa-like ensuite bath featuring a lavish soaking tub & sauna. Upstairs, the swee
Belle just like the Ave it seats on. .. A white picket fence borders the shaded & landscaped lawn, while a freshly paved walkway leads to a covered front porch. Inside, light shines through the living room's plentiful windows & reflects off the crisp, white walls & vibrant original parquet hardwood floors that extend throughout the home. The stylish kitchen with stone countertops, endless storage, & stainless steel appliances opens to a sun-drenched dining room where you can dine inside or push open glass doors to enjoy a meal al fresco on the elevated back deck overlooking the private backyard. Embrace luxurious outdoor living with a hot tub, spacious patio, & s
Elegant Portola Estates Home with ADU potential, Privacy and Sweeping NW views overlooking the iconic Frank Lloyd Wright Marin Civic Center. Nestled at the top of a cul de sac, this 2317sf 4BD 3BA home has a remodeled main level primary suite plus the perfect blend of style and indoor/outdoor living. Living room with hardwood floors and fireplace, formal dining room, and a chic galley kitchen. Lower level has the 4th bedroom, 3rd full bath, a huge family room with 2nd fireplace, wet bar and a separate entrance. 500+ sf of extra finished bonus space behind lower level is ideal for home office, gym, or art & crafts studio. The backyard is a tropical paradise and enjoys a variety of frui
With gorgeous views across the San Francisco Bay, in a relaxing, private setting, this one level Mid-Century Modern home is in the esteemed Country Club area of East San Rafael. This recently renovated beauty, surrounded by larger, luxury homes, is on a 0.85-acre lot with views of the Marin Yacht Club and San Francisco Bay. Floor-to-ceiling windows bring in natural light and views into the spacious great room. An ideal indoor-outdoor flow throughout lends for gracious entertaining and family gatherings. Newly painted inside and out, a new kitchen, bathrooms, flooring, lighting, landscaping and more! New patio and lawn for outdoor enjoyment. Detached two car garage. Shopping and dining are c
Explore this exquisite 5-bedroom, 2.5-bath residence, sprawling over 3,500 square feet of sophisticated living space. Elevated to capture awe-inspiring views of the bay and Mt. Tam, this home seamlessly blends luxurious living with tranquil surroundings. The home features a stunning wrap-around deck that offers breathtaking views perfect for quiet reflection or lavish entertaining. The views extend into the home, visible from the light-filled living room, elegant dining area, and the remodeled kitchen, which is outfitted with top-of-the-line appliances, beautiful stone countertops, and ample storage. The living area filled with natural light from large expansive windows, offers a warm spac
Sweet Marinwood prime cul de sac location; one of just four homes bordering an open space hillside dotted with majestic oak trees. This one level 4-bedroom, classic ranch style flows effortlessly to an atrium deck and lush private backyard with wide open views to the hillside and perfect southwest exposure. The kitchen offers a breakfast room that leads to the expanded family room with views out to the hillside. Newly painted interiors with refreshing neutral tones and refinished oak floors in every room except kitchen, breakfast and family room. The brick formal entryway wraps around to frame the fireplace and adds an enjoyable feature wall. The 4th bedroom off the living room is perfect f
BUY THIS HOME AND WE'LL BUY YOURS! Affordable living in Marin. This home in San Rafael is a must see, must come to visit this awesome home located in beautiful, peaceful Contempo Marin. This home has 3 bedrooms, 2 full bathrooms and a bonus room. Dining- living room combo, big open kitchen. Central heat. Club house, Gym, heated pool and hot tub. Golf at McInnis Golf Club, Transportation, Restaurants, Hiking trails, Dog park, Skate park. Mary E. Silveira AWARD Winning School District and much more.
Welcome home to 519 Wisteria Way to your perfect sanctuary. Discover comfort in this stunning one-story abode nestled in a thriving community of Terra Linda. This alliance-built home offers the best of modern living with 4 bedrooms, 2 baths and a design that maximizes both space and style. Immerse yourself in a neighborhood boasting excellent schools, ensuring your families education needs are meet with ease. Enjoy the convenience of nearby shopping, making errands a breeze and enhancing your life style. Cooking with gas in your freshly painted kitchen which includes stainless appliance and stackable washer/dryer. Step into your lush back yard with new landscaping every corner exudes charm.
Sophisticated quality construction with stunning Mt. Tam views in San Rafael's coveted Dominican flats! Pure contemporary aesthetics, rare scale & proportions, and eco-friendly features present in every detail. Cleverly positioned on a 1/2-acre private, & quiet yet walkable lot. Soaring ceilings, expansive windows & abundant natural light throughout. Gorgeous maple floors, great built-ins & three fireplaces. Large social spaces and seamless access to outdoors. Formal dining room for heartwarming gatherings. Spectacular open kitchen with hip concrete countertops, custom cabinetry, stylish island & breakfast area opens to a cozy family room. Luxurious primary suit
Step into the comfort of this chic, two-story home in the prestigious 'The Peninsula' phase of Baypoint Lagoons, offering a luxurious waterfront lifestyle. Feel the calming breeze and enjoy serene scenes over the Richmond Bridge from this elegantly appointed sanctuary. The home boasts a spacious open floor plan with cathedral ceilings and large windows that capture ample natural southern light and expansive views. Features include a cozy gas fireplace, sleek bamboo flooring, and custom drapery, enhancing the modern aesthetic. A gourmet chef's kitchen equipped w/ new stainless steel appliances, including a refrigerator and oven. With an opening to a low-maintenance backyard with a brick pati
This charming home nestled in a private cul-de-sac offers a nice blend of space, comfort, and serenity. 4 bedrooms and 2.5 baths provide ample room for both relaxation and entertainment. As you step inside, you'll be greeted by the home's original charm, featuring wood floors and vaulted ceilings. Large decks beckon you to unwind amidst the tranquil surroundings or host lively gatherings with loved ones. The main level seamlessly integrates a living room with fireplace adjoined to the dining area, creating an inviting space for shared moments. The kitchen flows into a sunny family room. A spacious ensuite primary bedroom offers a private retreat, with three additional bedrooms, laundry room
Discover 1380 Lincoln Ave, newly converted to residential apartment complex, located in the beautiful county of Marin, right in the heart of San Rafael. With 9 turnkey units boasting strong rents, this property presents an exceptional opportunity. Offering a diverse selection of units, including 3 studios, 4 one-bedrooms, and 2 two-bedrooms. Originally an office building, this property underwent a complete transformation in 2023, resulting in fully remodeled units featuring brand new cabinets, flooring, kitchens, bathrooms, and operating systems. Ample on-site parking, with 12 dedicated spaces available. Strong in-place rents, with built-in 3% annual increases stipulated in the leases. It's
Be prepared to fall in love with this masterpiece atrium-eichler single-family home in the highly desirable Marinwood Community neighborhood of San Rafael! You will be greeted with its elegant astonishing front yard landscape. Upon entering the home, you will find a fully upgraded stylish interior with craftsmanship. Laminate floor and recessed light throughout the house. Multi-zone cooling & heating air conditioning units around the living area. A separate office room filled with cozy natural lights. A modern style open design kitchen & cabinets with brand new stainless steel appliances. A spacious living room with a stunning electric fireplace makes it warm and enjoyable. The
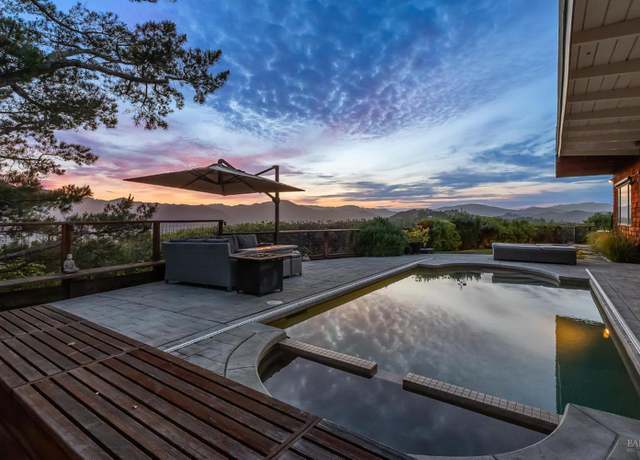
Lives like a single level, extremely private & sunny lot with a pool and west facing views. Completely remodeled Smart Home with New HVAC, Electrical, Tankless water heater. Nestled in a serene setting in Lucas Valley (Mont Marin), this meticulously updated residence showcases four entry-level bedrooms with continuous solid oak hardwood floors and modernized bathrooms. The remodeled kitchen includes quartz counters, high end SS appliances, a pantry closet and a pass thru window to the backyard deck and bar seating area. Its outdoor space is highlighted by a sparkling pool and expansive patio and deck, ideal for privacy and entertainment. The home features spacious living areas, includ
Discover luxurious living at 127 Peacock Dr in the heart of San Rafael! This stunning residence offers a perfect blend of elegance and functionality. Step inside to find a spacious open floor plan, seamlessly connecting the living, dining, and kitchen areas, ideal for effortless entertaining. Enjoy the Marin lifestyle with exceptional indoor-outdoor flow, perfect for gatherings or relaxation by the pool. With five bedrooms and three full bathrooms, including a master suite retreat with a spacious walk-in closet, there's ample space for friends and family. A dedicated laundry room adds convenience to your daily routine. The family room provides a cozy space for movie nights or quiet evenings
Nestled in nature, with views of the San Pablo Bay, and the northeast hills of San Rafael, 11 McCoy Road is just two minutes by car from downtown. A nearly 1/2-acre sanctuary with quiet walking paths nearby, this custom architect-designed home was constructed in 1979. Step down through the sunny patio and gracious front door into the main level flooded with natural light. The open floor plan features vaulted, open-beam ceilings, and walls of glass leading out to two decks. The recently remodeled chef's kitchen, designed for hosting, overlooks the large dining room with stunning views. A generously sized adjacent living room is equipped with a new gas fireplace. A half bath completes the mai
Indulge in the Villa Marin lifestyle with this exquisite 1 bedroom/studio unit, showcasing the finest features in Marin's premier 60+ community. Situated on the sought-after top floor, close to the center of the complex, this unit offers open-plan living with a touch of elegance. Step inside to discover new carpet throughout and an updated kitchen with quartz countertops, perfectly complemented by brand new appliances. Natural light floods the studio from the large windows. Relax in the sunroom, offering expansive North-West facing vistas of Terra Linda. The bedroom features an arched window, unique to the top floor, framing picturesque views and creating a serene retreat. Free communal lau
Experience the pinnacle of Marin living at Regency Estates with this recently remodeled contemporary home boasting Mt. Tam and hillside views. Spanning a massive 4426 sq ft per tax records, this custom-built gem features 4 beds, 3 full baths, and luxurious amenities. Wood and natural stone flooring, designer bathrooms, and a grand entry staircase create an inviting ambiance. The gourmet kitchen showcases Quartz countertops, a sophisticated island, and a spacious dining area that flows into the family room. Entertain in the formal living room with a three-sided gas fireplace or host in the formal dining room. A guest bedroom with outdoor access adds convenience to this living level. The secl
Welcome to 26 Roundtree Blvd. , where modern elegance meets tranquility in Marinwood. This 2-level townhouse-style condo offers comfort and style amidst lush greenery and Miller Creek's calming ambiance. Highlights: gourmet kitchen w/ Quartz countertops, two-toned cabinetry, stainless GE refrigerator, electric range/oven, GE dishwasher, Maytag microwave, stainless sink with Moen faucet, and a stylish faux brick backsplash. Dining Delight: adjacent dining area with a modern pendant light fixture. Relaxing Living Space: open living room with glass sliding door leading to a serene rear patio. Tranquil Bedrooms: two spacious bedrooms with plush carpeting and top-of-the-line window coverings. Up
Marin Condo at the best value! Welcome to this updated 2 bedroom, one bath ground floor condo rarely on the market with cash flow potential! Perfect investment opportunity with great tenants in place who wish to stay. Open floor plan with a large updated kitchen, marble slab countertops, beautiful cabinets & recessed lighting. Remodeled bathroom with marble vanity top, granite flooring & granite shower walls. All double-pane windows and slider. Private and cute patio leads to a spacious, peace & quiet courtyard, storage, laundry room and swimming pool. Extra storage in the patio area. Complex assigned one car parking located near the front door. HOA dues include exterior m
Attention Visionaries! 2 Erin Dr in San Rafael is Your Dream Canvas! Unleash the magic of this mid-century modern treasure nestled in Marinwood County Estates. Boasting 4 beds, 2.5 baths, and an expansive 8,580 sq ft lot, this 1,722 sq ft home is bursting with potential. Whether you're a seasoned contractor or an investor, 2 Erin Dr is your blank slate. A permit for kitchen renovations is ready, and the garage offers 441 sq ft to bring your visions to life. Educational and Outdoor Paradise: In the Miller Creek School district, it's an invitation to thrive in a vibrant community. With acres of open space and access to the coast, adventure awaits! Just a stone's throw from a luxury developmen
Charming side by side Duplex in the coveted West End neighborhood in San Rafael. Both turnkey units feature lovely Vintage details with hardwood flooring and dual pane windows. Larger unit boasts 1 bedroom, 1 bath plus bonus loft room/ 2nd bedroom with private deck, spacious eat-in kitchen overlooking patio and gardens. Second Sun lit unit has 1 bedroom, 1 updated bath with good sized living room with fireplace, wainscotting and an updated kitchen. The quarter acre lot spans up to Dunand Avenue. Additional amenities include, ample parking with a carport and two additional spaces, shared laundry, large basement storage area and separate meters. Minutes to the vibrant downtown area of San Raf
Tucked away at the end of a peaceful cul-de-sac in the highly sought-after Terra Linda neighborhood of San Rafael, 19 Santa Clara Court is a haven of luxury and an entertainer's delight. Spanning 2,950 square feet of living space (per Floor Plan Visuals), this home boasts five bedrooms, three and a half baths, a spacious and open great room, floor-to-ceiling windows, and an exceptional indoor-outdoor flow. The home offers a flexible floor plan that caters to a variety of lifestyles, marked by spacious living areas, and a seamless blend of indoor and outdoor connection. The outdoor living area features expansive decks that provide the perfect backdrop for al fresco dining, grand gatherings,
This area's enrollment policy is not based solely on geography. Please check the school district website for more information.
Elementary schools
Middle schools
High schools
GreatSchools Summary Rating
9/10
Ross Elementary School
Public, K-8
9/10
Hidden Valley Elementary
Public, K-5
8/10
Sun Valley Elementary School
Public, K-5
7/10
Adaline E. Kent Middle School
Public, 5-8
7/10
Anthony G. Bacich Elementary School
Public, K-4
Only showing 5 of
18 elementary schools.
School data is provided by GreatSchools, a nonprofit organization. Redfin recommends buyers and renters use GreatSchools information and ratings as a first step, and conduct their own investigation to determine their desired schools or school districts, including by contacting and visiting the schools themselves.Redfin does not endorse or guarantee this information. School service boundaries are intended to be used as a reference only; they may change and are not guaranteed to be accurate. To verify school enrollment eligibility, contact the school district directly.
Homes for sale in San Rafael have a median listing price of $1.05M. Some of these homes are Hot Homes, meaning they're likely to sell quickly.
What are some of the most popular neighborhoods in San Rafael?
Popular neighborhoods include Sun Valley, San Pedro Peninsula, Terra Linda, North San Rafael, Peacock Gap, East San Rafael, West San Rafael, Dominican-Black Canyon, Kent Woodlands, and Marinwood.
San Rafael, California boasts a well-structured transportation system, with a variety of options for residents. For those who prefer to drive their car, traffic levels can be high during peak hours, especially in the downtown area. Public transportation is readily available, with bus and ferry services providing regular routes throughout the city. Additionally, San Rafael is conveniently located near several major highways and freeways, including the US 101 and I-580, providing easy access to surrounding areas. Learn more on our San Rafael city guide.
What types of properties are available in San Rafael?
San Rafael, California offers a variety of single-family home types, including ranch-style, contemporary, and modern homes, each with their own unique architectural features and designs. These homes can be found throughout the city, from the charming neighborhoods near downtown to the scenic hillside communities. Most properties in San Rafael, California have three to five bedrooms and were built in various years. To explore different property types for sale in San Rafael, California, use the 'Home type' filter located above the active listings. Customize your search by selecting options like single-family homes, condos, townhomes, and more.
What is life like in San Rafael?
Living in San Rafael, California offers a unique experience with its picturesque landscape encompassing rolling hills, lush greenery, and stunning bay views. The weather is characterized by mild winters and warm summers, providing a pleasant climate throughout the year. The city boasts a thriving job market with diverse employment opportunities spanning various industries. Residents can engage in a wide range of activities, including exploring numerous parks and trails, enjoying water sports in the bay, and participating in cultural events and festivals. San Rafael truly embodies a vibrant and dynamic lifestyle for its residents to enjoy.
What are the schools and amenities like in San Rafael?
San Rafael, California, boasts an array of public amenities for the convenience and enjoyment of its residents. The city is home to a variety of restaurants, offering a wide range of cuisines to satisfy diverse tastes. Numerous parks provide recreational spaces for outdoor activities and relaxation. Essential services such as grocery stores are readily available, ensuring residents have easy access to daily necessities. Additionally, the city offers more amenities including libraries, fitness centers, and shopping centers, contributing to a comfortable and fulfilling lifestyle in San Rafael.
In the past month, 37 homes have been sold in San Rafael. In addition to houses in San Rafael, there were also 64 condos, 11 townhouses, and 6 multi-family units for sale in San Rafael last month. San Rafael is a moderately walkable city in Marin County with a Walk Score of 53. San Rafael is home to approximately 57,498 people and 35,405 jobs. Find your dream home in San Rafael using the tools above. Use filters to narrow your search by price, square feet, beds, and baths to find homes that fit your criteria. Our top-rated real estate agents in San Rafael are local experts and are ready to answer your questions about properties, neighborhoods, schools, and the newest listings for sale in San Rafael. Our San Rafael real estate stats and trends will give you more information about home buying and selling trends in San Rafael. If you're looking to sell your home in the San Rafael area, our listing agents can help you get the best price. Redfin is redefining real estate and the home buying process in San Rafael with industry-leading technology, full-service agents, and lower fees that provide a better value for Redfin buyers and sellers.


 REDFIN IS COMMITTED TO AND ABIDES BY THE FAIR HOUSING ACT AND EQUAL OPPORTUNITY ACT. READ REDFIN'S FAIR HOUSING POLICY AND THE NEW YORK STATE FAIR HOUSING NOTICE.
 United States
 Canada