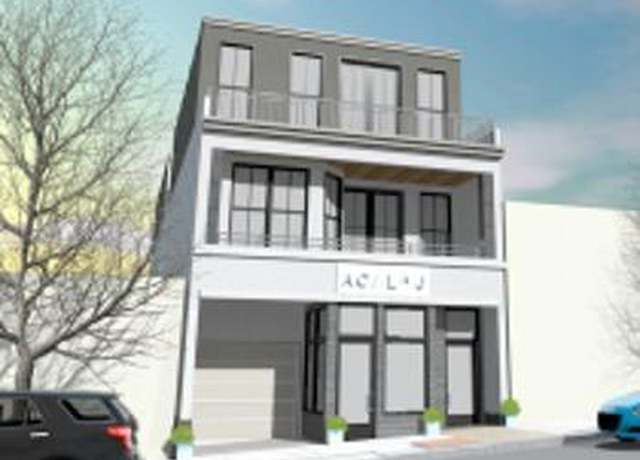
Planning approved plans for lot to build a 6516 (gross area) building with 4 units and 4 parking spots. Units include 3 residential units and 1 residential-work unit. Price is for sale of lot with the approved plans. Please reach out to listing agent for copy of approved plans.
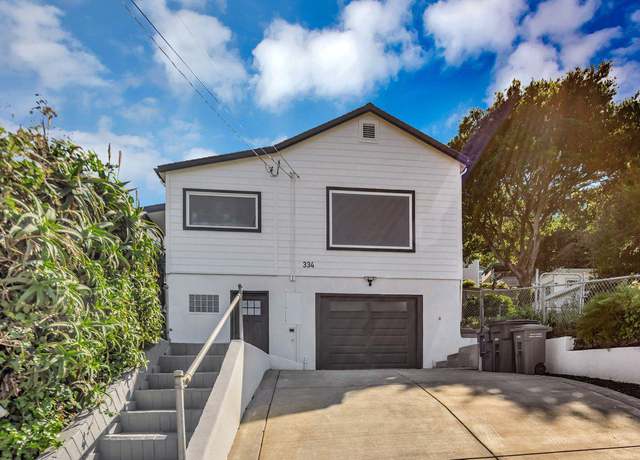
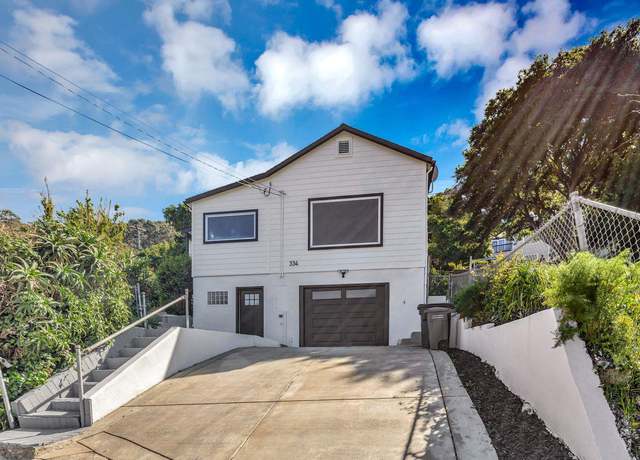
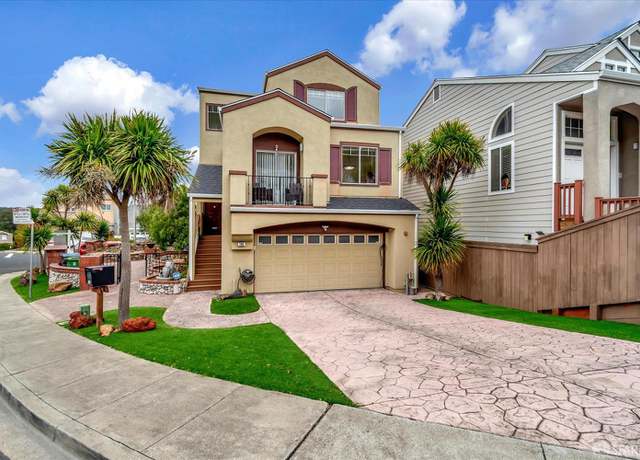
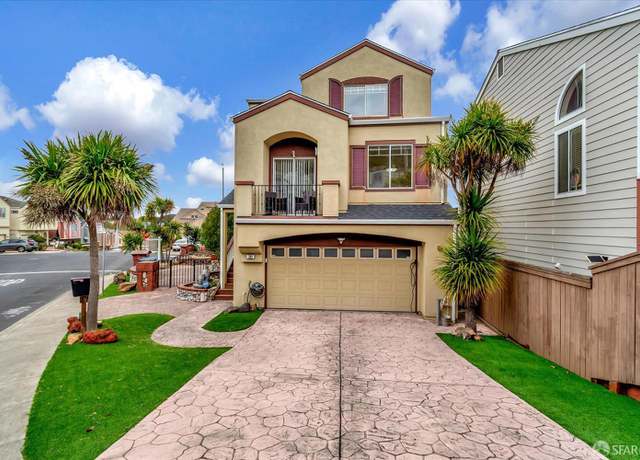
This beautifully remodeled 3 bedroom, 3 bath two story home is located in the hills of Brisbane with Bay Views. Subject property and the adjacent lot being sold as a package. The Adjacent Lot is listed at $275,000. Build an ADU. SB9 may allow for lot split. Buyers should check with the city to verify. The remodeled home features include a fully remodeled kitchen with quartz countertops, tiled backsplash, shaker cabinets, Samsung stainless steel appliances including a range oven with a hood, pendant lighting, center island with breakfast bar, engineered hardwood floors, double pane windows, freshly painted inside and out, a living room with San Francisco Bay views, the dining area, two prima
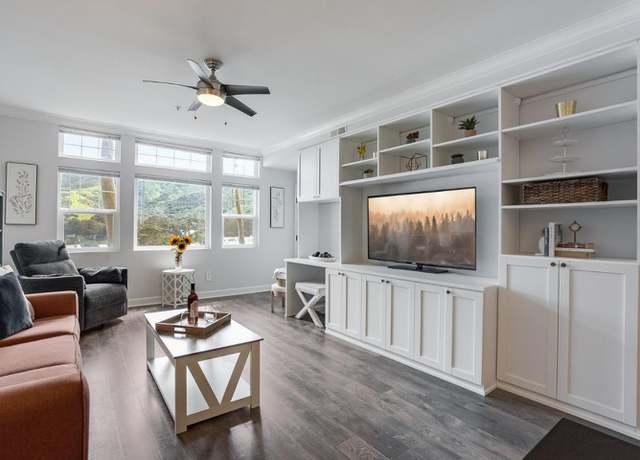
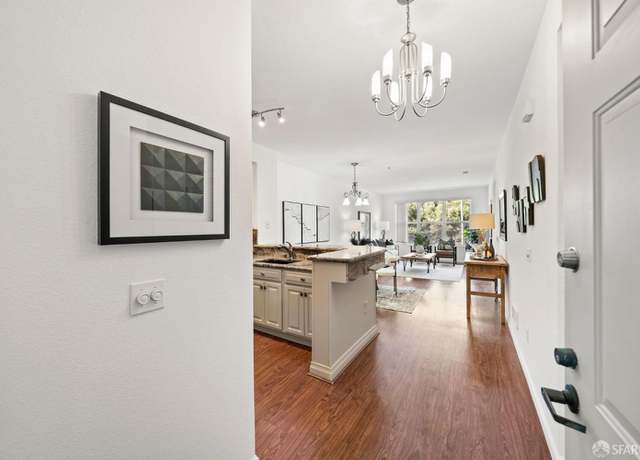
Beautifully remodeled, lovingly maintained and light-filled condo on ground floor in premier Altamar at the Ridge. Optimal and open floor plan facilitates easy and comfortable living. Updated kitchen with stainless steel appliances, granite counters and breakfast bar make mealtime a breeze. The attached dining area and living room are graced with large windows that frame stunning mountain views. Private balcony access from the living room and primary suite enhance your connection to nature and promote well-being. Convenient features include an office nook in the primary bedroom, dual vanities in the primary bathroom, in-unit washer/dryer, ceiling fans and 2 parking spaces. Additional seller
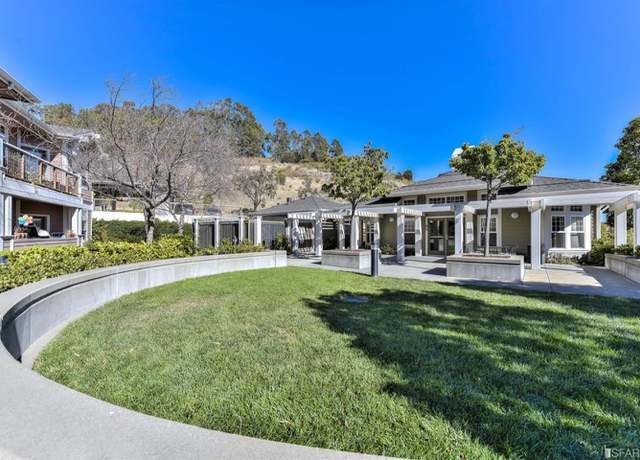
Lovely, well maintained 3 bedroom / 2 bath condo located in the highly sought after Altamar at The Ridge. This top-floor end-unit features excellent natural light, high ceilings, and serene views of San Bruno Mountain. Open concept living and dining room with fireplace and access to two spacious balconies. Kitchen features a breakfast bar and office nook. Primary bedroom suite with a walk-in closet, spacious bathroom, and balcony. Two additional bedrooms, a hall bathroom, and laundry area complete the floorplan. Parking includes one carport space and one uncovered space. Enjoy access to Brisbane's Community Pool, Park, and Garden, Mission Blue Center, as well as San Bruno Mountain State Par
Spacious 2 bedroom / 2 bath condo with bay views in the desirable Viewpoint at The Ridge. End-unit features natural light, high ceilings, and generous outdoor living space. Living room opens up to a large covered patio with views of the trees and water, perfect for outdoor entertaining. Separate dining area with a picture window and breakfast bar. Kitchen features generous storage and counter space. Primary bedroom suite with a walk-in closet, bathroom, and private balcony. An additional bedroom, guest bathroom, laundry room, and two-car garage complete this beautiful home. Enjoy amenities at the Viewpoint - HOA clubhouse, spa, fitness center, and playground - as well as access to Brisbane'
This description offers a captivating glimpse into a highly desirable property nestled within the Landmark community in Brisbane, one of Brisbane's most sought-after areas. Rare opportunity to reside in Brisbane's coveted Landmark community, with stunning mountain vistas. This refined 4 bed, 2.5 bath home features lavish upgrades, white carpet through the home, double-pane windows and amazing views. Lower level hosts four bedrooms, including a luxurious primary suite with spacious walk-in closets and an indulgent bathroom with shower and tub. Chef's kitchen on the upper level boasts a spacious island, premium appliances, and ample storage. Backyard oasis with trees and two-car garage. Enjoy
Located in the family friendly Sierra Point community, this brand new, single-wide 2bedroom, 1 bathroom, split floor plan, is approximately 600 square feet and features imitated wood laminate floors, carpet in both bedrooms, and 9' ceilings with a fan in the living-dining room-kitchen, crown molding, double pane windows with cornice boxes. The open kitchen has stainless steel appliances, and beautiful cabinetry. Towards the rear of the home there is one bedroom and a full-sized bathroom by the hallway. The other bedroom is by the front. This home comes with Central Heating and a Smart Thermostat. It has a space and hook-ups for a stackable washer/dryer. The home driveway can fit 2 cars
Welcome to this exceptional property nestled in Brisbane's vibrant heart, where luxury and functionality converge to create an unparalleled living experience. Step into a meticulously designed layout that effortlessly balances comfort and style. On the ground floor, you'll find a luxurious suite featuring a full bathroom and a spacious walk-in closet, providing a serene retreat for relaxation. The two-car garage offers ample storage space, supplemented by additional storage areas cleverly tucked beneath the stairs. Ascending to the second floor reveals a haven of tranquility. Well-appointed bedrooms, including a master suite with a spa-like bathroom and balcony overlooking the landscaped ba
Welcome to Landmark by Toll Brothers, where luxury living harmonizes with a pristine location. Nestled in the serene surroundings of San Bruno Mountain, this sprawling 3000 square feet home boasts 4 bedrooms and 2.5 baths filled with natural light. Revel in the elegance of hardwood floors, high ceilings, and modern finishes. The remodeled gourmet kitchen features top-of-the-line appliances, custom tile floors, and a walk-in pantry. Additional amenities include a formal dining room, separate family room, two fireplaces, separate laundry room, attached garage, and custom state-of-the-art finishes throughout. The large master suite offers a private deck and stunning views, with a spacious mast
Here's a rare chance to reside in one of Brisbane's most coveted areas. Nestled within the esteemed Landmark community, this residence boasts an expansive lot adjacent to open space, offering ample privacy and breathtaking mountain vistas. Step into this refined 5-bedroom home adorned with lavish upgrades, hardwood floors and double-pane windows. This sought after uphill model has one of most desirable floor plans. On the main level, discover two bedrooms, including the luxurious primary bedroom suite with dual walk-in closets. Its marble spa-like bathroom features a sauna for added indulgence. The upper level has three generously-sized bedrooms. One of these bedrooms is an ensuite, while t
Luxurious Modern Residence: This exquisite home epitomizes refined living, offering breathtaking vistas of San Bruno Mountain and abundant natural light throughout. Boasting 4 bedrooms and 4.5 baths, including 2 master suites, it features a spacious Family Room, separate Dining area, and dual laundry facilities for added convenience. The open-concept design seamlessly connects the impressive great room to the gourmet kitchen, equipped with top-of-the-line appliances: a professional gas range, separate Refrigerator & Freezer, ample cabinetry, and a generous walk-in pantry. Custom hardwood floors, designer lighting, plumbing fixtures, and an open beam ceiling enhance the elegance of the
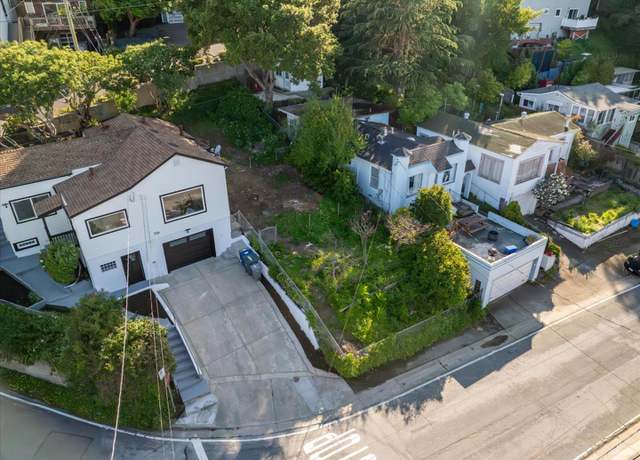
A great opportunity for a developer or contractor to build a home with Bay views on a lot in Brisbane. Build your dream home and enjoy the uniqueness of the Brisbane community, a charming town of 4,500 residents nestled in the hillside of San Bruno Mountain. Brisbane, the City of Stars. Utilities are available. Located on Seirra Point Road. Corner of Sierra Point Road and Humboldt Road. Approximately 2,520 square feet. A. P. N. # 007-425-100 Being sold as a package along with 334 Sierra Point Road which had a beautifully remodeled 3 Bedroom, 3 Bath home and is listed at $1,200,000.
Discover the perfect canvas for your Dream Home with breathtaking panoramic views of San Francisco Bay and the City Skyline. Nestled in one of Brisbane's private enclaves on San Bruno Mountain, the gently sloped terrain accommodates a single-family home with an accessory dwelling unit. Surrounded by luxury homes, this locale radiates beauty and prestige. Brisbane's building and planning departments ensure seamless processes with quick permit turnaround times. Enjoy nearby hiking, biking, and running trails, plus convenient access to San Francisco and Silicon Valley. With easy freeway access, public transportation, shopping, community parks, Brisbane swim and tennis facilities, and Marina, a
Excellent opportunity to build a home on a lot in Brisbane. Easy access and utilities are available. Brisbane is a small and charming town of around 4,500 residents that is nestled in a quiet hillside of San Bruno Mountain. It lies adjacent to the San Francisco Bay and is only minutes away from the San Francisco and South San Francisco borders. It has a total area of 20.5 square miles, with 17 square miles of it being water. The town enjoys generally sunny weather. The sense of community in Brisbane is notably one of its greatest assets. The people of Brisbane are welcoming and involved, as well as committed to working for the benefit of all. The town enjoys annual Concerts in the Park, com
Please visit this beautiful condominium by the bay with immediate access to San Francisco and peninsula. Featuring 2 bedrooms and 2 bathrooms; this gated community offers accessibility and convenience at an affordable price. With in unit washer and dryer, new carpet, fresh paint; the home is move-in ready. It also comes complete with deeded 1 car parking and an additional storage locker. Probate sale under IAEA. Court confirmation is not required.
Nestled in the highly desirable Bay Ridge Community with sweeping San Francisco Bay views! This 4 bedroom / 3 bath former model home beauty boasts an open floor plan space that consist of a living/dining room with entry to a private balcony, family room w/ custom fireplace and built-in cabinets, kitchen equipped with stainless steel appliances, breakfast bar, and ample pantry space, en-suite with bathroom that has his/her sinks and an oversize tub, and a Lower level flex room with separate entrance. Other amenities include dedicated washer/dryer room, laminate flooring throughout, ceiling fans, recessed lighting, mirrored closets, 2-car garage, fire suppression system, and a custom concrete
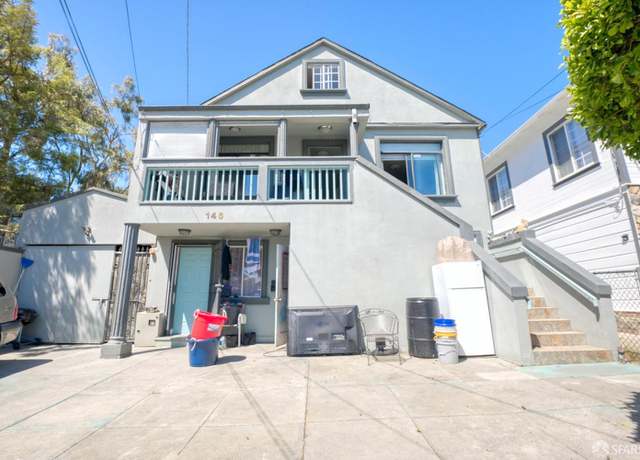
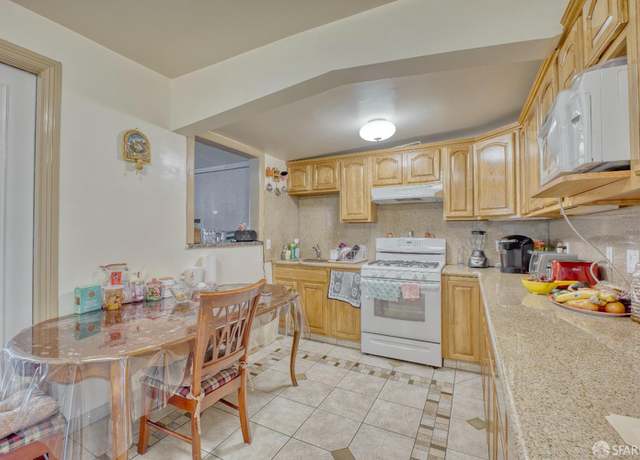
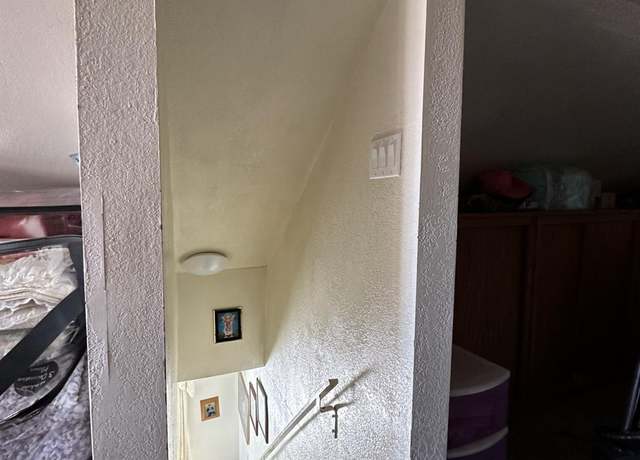
Spacious home w/ owner additions made without permits. Home shows well with updated kitchen and bath. Large 4,182 sqft. lot. Motivated owner wants to sell as-is condition.
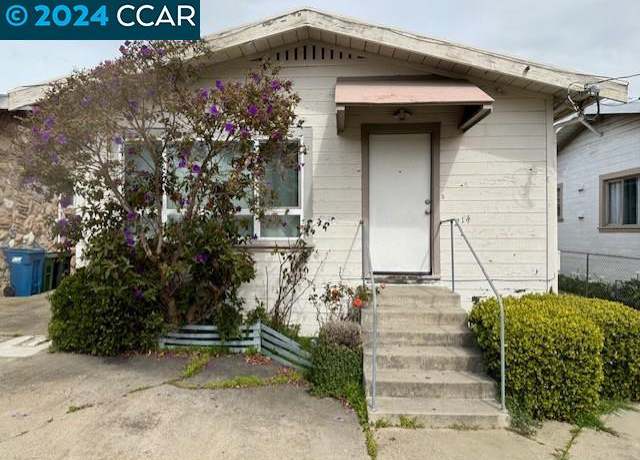
Great opportunity to own in the Bayshore side of Daly City. This bungalow has potential to be a darling 1 bedroom and 1 bath with a wood burning fireplace and a detached garage with additional parking. There is an existing structure that could offer more possibilities. It also might be the perfect spot for a remote worker who is looking for an easy commute to San Francisco, SFO, the San Francisco Bay Area, or Silicon Valley.
Discover this recently renovated gem nestled in the convenient locale of Visitation Valley. Boasting two bedrooms and one bath upstairs, the home features a brand-new kitchen with elegant granite countertops, offering both functionality and style. Step into the inviting backyard, and fragrant lemon trees. Downstairs, find an additional bathroom, complemented by a full bath and a convenient wet bar, perfect for entertaining guests. Don't let this opportunity slip away make this beautiful house your home today. New Roof and New Paint. Don't miss the chance to own a piece of tranquility in Visitation Valley. Please note that Kitchen, living room, bedrooms, back yard are Virtual Staging
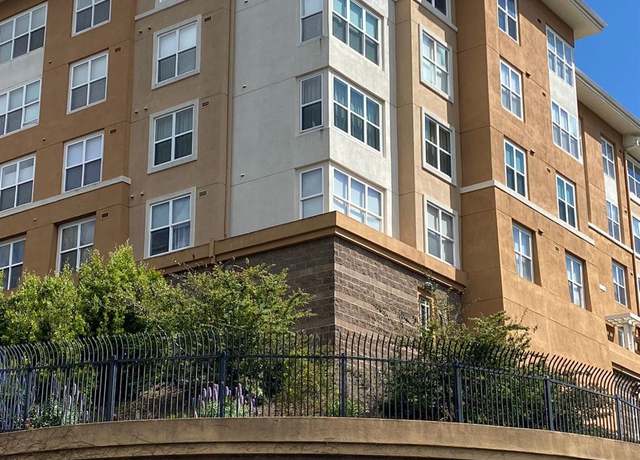
Luxurious, rarely available corner unit condo featuring high ceilings with extra large patio! Tastefully renovated home with modern wood flooring, upgraded kitchen with waterfall island, quartz countertops and stainless steel appliances. Designer upgrades in bathrooms with quartz countertops and contemporary hardware. Spacious bedroom with two large closets. Washer/dryer in-unit. Deeded 1 car parking. Convenient location, close to Highway 101 and the Caltrain Station providing easy access to SF Downtown, Airport & the Peninsula. Free shuttle to BART Station. Gated community with 247 security. HOAAmenities include: Gym, guest parking, BBQ area and free commuter shuttle service.
Perched along the hillside of Bayshore, this darling 2-bedroom home awaits you. While being a bit economical size, this home well makes up for in other features. Just imagine a coffee on your own front deck looking at the bay. There is full basement on the lower level for other improvement ideas. Being detached on one side, lots of natural light fills the interior. There is also a nice backyard with mature trees. Protected by the San Bruno Mountain, Bayshore has the sunshine. School, rec. center, library, and Muni bus line are all nearby. Bayshore school is elemamentry and middle school. Call and schedule your preview today.
This centrally located condo is perfect for first time home buyer, investors and commuting to San Francisco or the South Bay. Situated within a private, gated community sits this elegantly updated condo nestled conveniently to freeway & FREE Shuttle for residents to Caltrain, BART, or MUNI makes this a commuter's dream! An open concept living/dining, abundant lighting, fireplace, and a breakfast bar. Master suite with spacious walk-in closet & very spacious bathroom with/dual sinks. This unit comes with an in-unit washer and dryer. One huge bonus is this unit comes with two (2) deeded underground parking spaces since not all the units in the complex come with 2 parking spaces.
This corner residence features 3 bedrooms, 2 bathrooms, and a private balcony with water views. It comes with a 1-car garage parking space in a gated and well-maintained community at Candlestick Point. The entire residence boasts wood flooring, and it showcases a grand kitchen setup along with a private balcony offering partial water and mountain views. Nearly all light switches are smart switches controlled via phone. Additionally, the residence features upgraded washer and dryer units, a kitchen exhaust hood, and is move-in ready for new homeowners. Plenty of natural light fills the space, offering sweeping Bay views from the living room, bedrooms, and kitchen. The generously-sized bedroo
Discover the charm of this top floor, corner unit with 2 bedrooms and 2 bathrooms spanning 1106 sq. ft. Enjoy an abundance of natural light highlighting the wood floors and new carpet. The kitchen boasts maple cabinets, stainless steel appliances, granite countertops, and a gas range. Crown molding adds an elegant touch throughout. The primary suite offers a walk-in closet and double sinks. Relax on your balcony, located off the living room and enjoy peek-a-boo bay views from living room and second bedroom. Additional amenities include in-unit washer/dryer, one secured parking space, and a gated entrance to the complex. This is the perfect blend of comfort and style.
Offer Accepted by County. Confirmation Hearing will be on 04/25/2024 at 9:00am. County court house 400 County Center Redwood City Ca. Up-Bid opportunity in court begins at $694,550.00. Bidding by interested parties will be permitted as per probate court rules. These condos are seldom available and much sought after. With a Chefs kitchen which includes JennAir gas range and beautiful cabinetry. In unit Laundry and extra office or lounge area make the unit shine with possibilities. Bamboo flooring and Berber carpet really set off the magnificent 180 degree unobstructed bay , city, and peninsula view. Two car parking is included in the secure garage with visitor parking in a separate gated gar
$699,000
1 bed1 bath893 sq ft
1 Mandalay Pl #1209, South San Francisco, CA 94080
Simple living starts here. This rarely available penthouse level condo in the luxurious high-rise offers gorgeous Peninsula views, higher ceilings, fresh interior paint, tile and hardwood flooring, a modern kitchen with newly upgraded LG appliances, recessed lighting, full sized LG W/ D, plus a space for extra storage or a minimalist home office. Building amenities include a controlled-access for security, a grand lobby with high-end finishes, a fitness center, and a social room with a kitchen and a veranda. Nearby parks and hiking trails, Oyster Point Pier, the SSF Biotech hub, Costco, BART, Caltrain, SFO airport, and SSF downtown restaurants and shops. Easy freeway access and EV charging
$812,000
1 bed1 bath893 sq ft
1 Mandalay Pl #1509, South San Francisco, CA 94080
This is a 360-degree city of San Francisco Bay view lot, Block 4598, Lot 015, and is 5,200 square feet. The lot has legal access from either Hawes Street or Evans Ave. Currently a simple bridge can easily access the property. An ultra-modern home on concrete pilings, solar panels, a water well and state of the art septic system can be built to be all self-contained! There is a local park Across the street for a nice neighborhood stroll. Mixed use property! May be sold with lots 13,14, & 15 can be used for recreational purposes such as boat docks, pontons storage and water skiing uses with all the lots together it will be over 19,000 sq feet
This updated and spacious 2 bedroom, 2 full bath corner unit condo in the sunny, gated Candlestick Cove community features a floorplan designed for comfortable living, upgrades throughout and easy access to SF and the Peninsula. The centerpiece is an upgraded kitchen featuring a gas stove and granite countertops which opens to a large and comfortable living room which boasts large windows, lets in lots of light and has access to a private deck with views to the bay. The oversized primary bedroom suite can easily fit any size of bed with plenty of room to spare, has views to the bay and a walk-in closet. The primary bath features dual vanity sinks and a recently updated shower. The unit come
Beautiful Views! Spacious corner unit with beautiful BAY/CITY VIEWS!! Quiet gated community with 24-hr security service, free shuttle to & from BART Station, easy access to MUNI Bus routes and freeways. This corner unit features more windows with more natural sunlight, a large master bedroom, private balcony, in-unit laundry hookups, 1 garage parking space, guest parking available, elevator in building and gym in the same building. 2-Bedroom/2-Bath Below Market Rate (BMR) housing opportunity available at 120% Area Median Income (AMI). Maximum income for 2 people = $133,000; 3 = $149,650; 4 = $166,250, etc. Must be 1st-time homebuyer & income eligible. Unit available thru the May
Pride of Ownership !Price Reduced! 2 bedrooms Below Market Rate (BMR) housing opportunity available at 120% Area Median Income (AMI). Maximum income for 2 people = $133,000; 3 = $149,650; 4 = $166,250, etc. Must be 1st-time homebuyer & income eligible. Unit available thru the Mayor's Office of Housing and Community Development (MOHCD) & subject to resale controls, monitoring & other restrictions. Unit will be listed on DAHLIA, the SF Housing Portal (https://housing. sfgov. org). Starting on the application date on 10/27/22.First come first serve . https://housing. sfgov.org for application & program info. Fair housing opportunity! Premium corner Condo at desirable C
School data is provided by GreatSchools, a nonprofit organization. Redfin recommends buyers and renters use GreatSchools information and ratings as a first step, and conduct their own investigation to determine their desired schools or school districts, including by contacting and visiting the schools themselves.Redfin does not endorse or guarantee this information. School service boundaries are intended to be used as a reference only; they may change and are not guaranteed to be accurate. To verify school enrollment eligibility, contact the school district directly.
Homes for sale in Brisbane have a median listing price of $1.79M. Some of these homes are Hot Homes, meaning they're likely to sell quickly.
What are some of the most popular neighborhoods in Brisbane?
Popular neighborhoods include Visitacion Valley, Central Brisbane, Southeast San Francisco, Sterling Terrace / Stonegate, and Paradise Valley-Terrabay.
Brisbane, California, boasts a robust transportation network, making it easy for residents to navigate the city by car. Despite occasional congestion during peak hours, the overall traffic levels are manageable, ensuring smooth driving experiences. The city is also serviced by an efficient public transportation system, offering a convenient alternative to driving. Furthermore, Brisbane is strategically located near major highways and freeways, providing quick and easy access to surrounding areas.
What types of properties are available in Brisbane?
Brisbane, California offers a variety of single-family home types, including ranch-style homes, contemporary homes, and modern homes, among others. These homes can be found throughout the city, with some located in the central area and others in the surrounding neighborhoods. Most properties in Brisbane, California feature two to four bedrooms and were built in various years. To explore different property types for sale in Brisbane, California, use the 'Home type' filter located above the active listings. Customize your search by selecting options like single-family homes, condos, townhomes, and more.
What is life like in Brisbane?
Living in Brisbane, California offers a unique experience with its picturesque surroundings. The landscape showcases a harmonious blend of hills, valleys, and breathtaking views. The weather is characterized by mild winters and pleasant summers, providing an ideal climate for outdoor activities. The town provides a variety of job opportunities across different industries, ensuring a diverse and thriving economy. Residents can enjoy a range of recreational and cultural activities, including parks, trails, and community events that cater to various interests and hobbies.
What are the schools and amenities like in Brisbane?
Brisbane, California offers a variety of public amenities to enhance the lifestyle of its residents. The town boasts a selection of restaurants, providing a diverse range of culinary experiences. For those who enjoy outdoor leisure, numerous parks are available for relaxation and recreation. Essential shopping needs can be met at the local grocery stores in the area. Additionally, more amenities such as a library, community pool, and fitness centers are available to cater to the varied interests of Brisbane residents.
In the past month, 2 homes have been sold in Brisbane. In addition to houses in Brisbane, there were also 2 condos, 1 townhouse, and 1 multi-family unit for sale in Brisbane last month. Find your dream home in Brisbane using the tools above. Use filters to narrow your search by price, square feet, beds, and baths to find homes that fit your criteria. Our top-rated real estate agents in Brisbane are local experts and are ready to answer your questions about properties, neighborhoods, schools, and the newest listings for sale in Brisbane. Our Brisbane real estate stats and trends will give you more information about home buying and selling trends in Brisbane. If you're looking to sell your home in the Brisbane area, our listing agents can help you get the best price. Redfin is redefining real estate and the home buying process in Brisbane with industry-leading technology, full-service agents, and lower fees that provide a better value for Redfin buyers and sellers.


 REDFIN IS COMMITTED TO AND ABIDES BY THE FAIR HOUSING ACT AND EQUAL OPPORTUNITY ACT. READ REDFIN'S FAIR HOUSING POLICY AND THE NEW YORK STATE FAIR HOUSING NOTICE.
 United States
 Canada