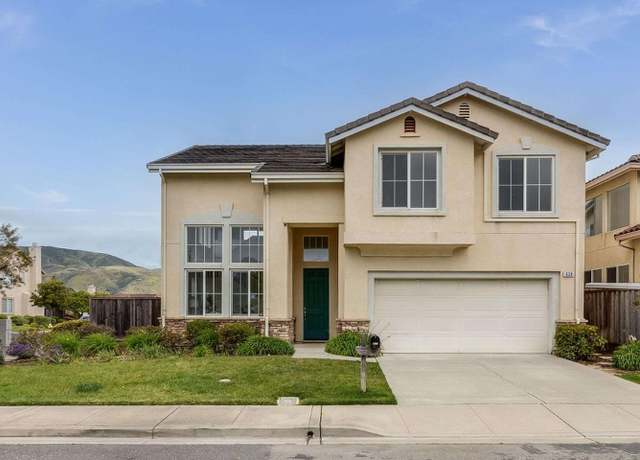
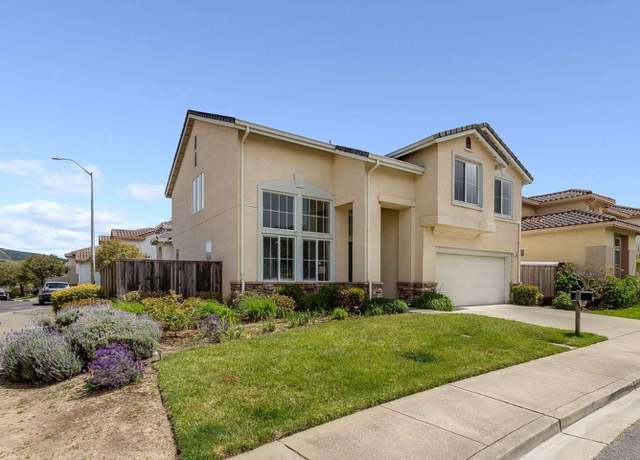
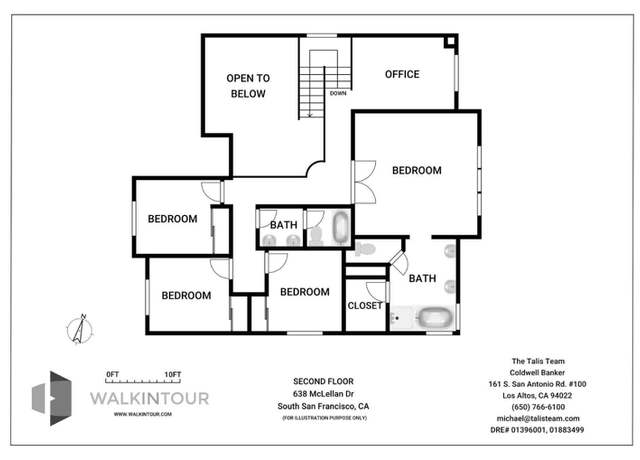
Beautiful four-bedroom house located in the desirable Promenade neighborhood of South San Francisco across the Alta Loma Park. Best location in the development. Spacious 2390 square foot home with excellent floor plan and abundance of natural light throughout. Two-story-high ceiling in the entrance and in the living room. Large primary suite. Good size open den can be transformed into the fifth bedroom (buyer to verify). Multiple recent updates: interior paint, floors, kitchen counters, etc. Close proximity to 280, 101, El Camino Real and BART. Close proximity to Kaiser Permanente, Costco, Trader Joe's, Serramonte Shopping Center, Safeway and a wealth of shopping and restaurant destinations
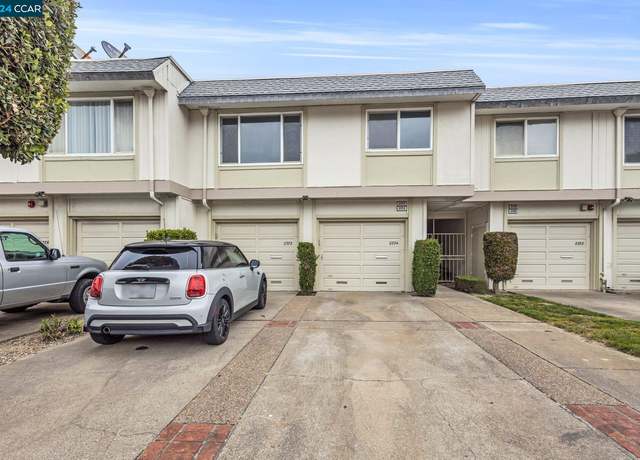
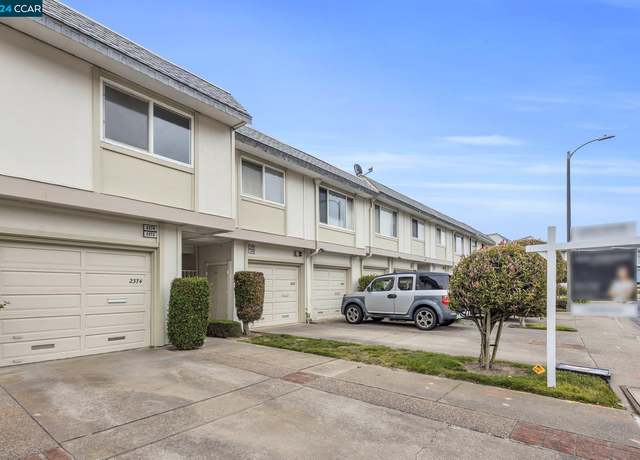
2374 Greendale Dr, South San Francisco offers a two-bedroom condo on the upper floor and a two-car tandem garage on the ground floor. This home features brand new designer paint, waterproof plank flooring, new LED lights, as well as updated kitchen and bathroom. Its prime location provides easy access to SFO, shopping centers, freeways, schools, major companies, and public transportation. This is an excellent opportunity for first-time buyers or investors, particularly with the low HOA fees. Call now to arrange a private tour.
Bright and spacious BMR (below market rate) Home in a highly sought-after complex in South San Francisco. The unit is move-in ready with many upgrades that you are looking for. Walking distance to shopping and dining areas, and easy access to freeway making the commute to San Francisco or South Bay to be very convenient. Maximum household incomes cannot exceed 120% of the San Mateo County Area Median Income. Maximum income for 2 person = $168,000; 3 = $189,000; 4 = $210,000. Prospective BMR buyers must submit a complete pre-qualifying application in addition to a lender pre-approval letter to start the eligibility process. Incomplete applications will not be reviewed. APPLICATION DEADLINE
Welcome home to this rarely available corner unit! First floor condo located in the desirable Westborough area! This bright home boasts new laminate flooring, & fresh paint throughout! Spacious living room & dining area with cozy fireplace! Sliding glass doors from living room lead to a private, enclosed patio! Kitchen features granite countertops, modern stainless steel appliances & microwave/hood combo. Spacious primary bedroom with second bedroom location is perfect for work-from-home, or guest bedroom options. Remodeled bathrooms with convenient in-unit washer/dryer hookups! Move-in ready home also comes with one assigned parking garage with remote and another permitte
Welcome to 2242 Wexford Ave in South San Francisco! This stunning home has undergone a cosmetically renovated transformation, featuring 4 bedrooms and 2.5 baths. The kitchen, bathroom, and flooring have all been tastefully renovated, creating a fresh and modern aesthetic throughout the home. With brand new appliances and a beautifully painted interior, every detail has been carefully considered. Convenience is key with an attached 2-car garage, making parking hassle-free. Step outside onto the new spacious deck and enjoy breathtaking views of the park below. With easy access to the park and playground, outdoor fun is just steps away. Located in a family-friendly neighborhood, this home is z
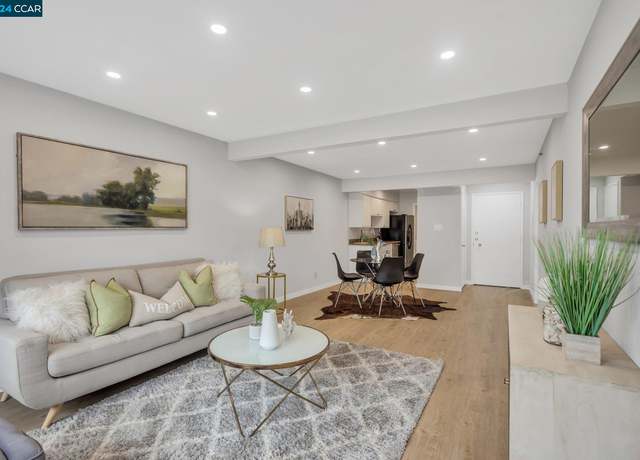
Discover modern luxury in this renovated 3 bed, 2 bath condo spanning 1,273 sq. ft. Features include a sleek kitchen with waterfall island, 2 wine refrigerators, renovated bathrooms, new flooring, a deck with tree views, and in-unit laundry. Enjoy HOA amenities like pool, gym, racquet courts, clubhouse. Take a stroll to Westborough Shopping Plaza (Philz Coffee, Paris Baguette) and adjacent Sellick Park! Conveniently located to SSF Biotech companies, BART, Highways 280 & 35 to coastal beaches. SCHEDULED HOA exterior painting in appx 3 weeks. Patio photos digitally staged as a preview of exterior. HOA includes water, garbage, sewer and exterior maintenance. 1 Deeded parking garage. Park
$778,000
3 beds2 baths1,273 sq ft
1 Appian Way Unit 713-5, South San Francisco, CA 94080
Gorgeous, fully updated/refreshed Sunshine Gardens Desirable Corner! Well appointed 3 bed/1 bath home on a Huge/sunny corner lot. Landscaped front/back yards and a backyard patio and fully fenced/private backyard. Bathroom has new vanity, sink and refinished tub/tile/floors. Kitchen features beautiful granite counters with glass block back splash, all new cabinets, all new SS appliances, new Microwave vent hood and one electric available cabinet for use for other kitchen appliances. Entire house has new wood laminate flooring, all new windows, fresh paint in/out, new light fixtures/hardware, new window blinds, new interior doors and a newly built fireplace mantle. Washer/dryer included (in
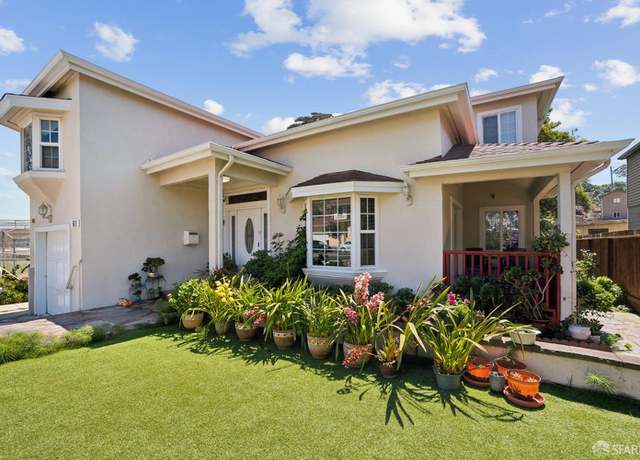
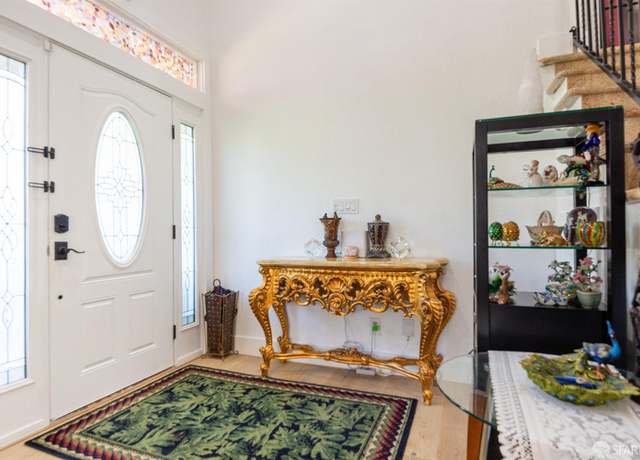
This home offers a delightful blend of vintage charm and modern amenities, making it a desirable residence in a well-established neighborhood, and centrallocation in South San Francisco. Less than 5 miles from SFO Airport, desirable location for business, investment and raising a family in the heart of the Peninsula. Less than one mile away, a brand new community civic center with a public library and park was build in 2023. Two blocks away is a newly build recreation park for many sports, dog park, and new swimming pool coming soon. This charming multi-generational 5-bedroom, 4-bathroom single-family home built in 1928 and remodeled with permits in 2019. The property features 3 master suit
Welcome to 280 Village Way - this quaint 3-bedroom, 3-bathroom home boasts 1,460 square feet of comfortable and bright living space. Noteworthy is the newly legalized ADU with a complete kitchen - perfect for guest quarters or generating additional passive income. The primary bedroom includes direct access to a beautiful deck, ready for al fresco dining and relaxation, plus a large en suite bathroom with double vanity sinks and shower over tub. Enjoy a private low-maintenance backyard with space to garden or host an outdoor housewarming party. Attached garage provides parking convenience and extra storage space. Conveniently located near 101 for a quick commute to nearby shopping & di
Do you need A LOT OF ROOM? Do you need a THREE CAR GARAGE? Look no further! This 2210 sq. ft. home features 4 bedrooms, 3 bathrooms plus 2 bonus rooms. One of the bonus rooms is very large, as it was set up with a miniature train village. (Just think of the possibilities!) The second bonus room situated off the living room, could be used as an office or art/yoga studio, plus it has a closet. The garage is single wide but long enough for 3 cars. The owners stored a boat and two cars in it! There is additional space for two cars in the driveway. This home features a gas log fireplace plus central heat and double pane windows. Nice upgraded laminate flooring. The backyard is full of many inter
An amazing opportunity to purchase a BMR (below market rate) condo in the highly sought-after South City Lights community. This unit features a primary bedroom and ensuite bath with dual vanity sinks and a walk in closet plus additional bedroom and full bath. Great amenities include a private patio deck, in-unit washer/dryer and 2 car side by side garage parking. Walking distance to shopping and dining areas, and easy access to freeways making and easy commute to San Francisco or South Bay. Maximum household incomes cannot exceed 100% of the San Mateo County Area Median Income. Maximum income for 2 person = $140,000; 3 = $157,500; 4 = $175,000. Prospective BMR buyers must submit a complete
$663,926
2 beds2 baths1,026 sq ft
2230 Gellert Blvd #3203, South San Francisco, CA 94080
Welcome to your ideal South San Francisco townhome! This bright and private residence is centrally located within walking distance to Bart, Starbucks, Costco (including Costco Gas), Trader Joe's, and more. With new carpeting throughout, the home is move-in ready. The kitchen features a spacious island and breakfast bar, perfect for entertaining. Upstairs, dual en-suites offer spacious bathrooms and ample closet space. Enjoy the convenience of a washer and dryer located next to the bedrooms. The 2-car tandem garage includes an oversized workshop/storage area, and an outdoor patio is ideal for relaxation or gardening. Don't miss out on this fantastic opportunity!
The SRO hotel in South San Francisco is a 29-room establishment located strategically near the downtown area, offering convenience to guests seeking local attractions and transportation. Its prime location ensures consistent occupancy rates and revenue streams, appealing to both business and leisure travelers. With the city's growing tourism industry and well-maintained facilities, investing in this hotel promises financial rewards and participation in a thriving hospitality market. Positioned just a block away from the bustling downtown of South San Francisco, the SRO hotel presents an attractive investment opportunity. Its 29 rooms benefit from high foot traffic and accessibility to local
Discover the epitome of luxury townhouse living in this exquisite brand new 4-bedroom, 3-bathroom property ideally located just about a mile away from both BART and Caltrain stations, ensuring a stress-free daily commute. With a modern design, laminate floors throughout, quartz countertops, and an island in the kitchen. The balcony boasts some of the best views! This meticulously designed home exudes elegance and sophistication in every detail, while its family-friendly surroundings and nearby parks create the perfect environment for quality family time. With the added convenience of 2 nearby bus stops and a one-car garage, public transportation accessibility and vehicle protection are guar
$1,310,000
4 beds3 baths1,623 sq ft
645 Baden Ave Unit G, South San Francisco, CA 94080
Discover the epitome of luxury townhouse living in this exquisite brand-new 4-bedroom, 3.5-bathroom property ideally located just about a mile away from both BART and Caltrain stations, ensuring a stress-free daily commute. With a modern design, laminate floors throughout, quartz countertops, and an island in the kitchen. The balcony boasts some of the best views! This meticulously designed home exudes elegance and sophistication in every detail, while its family-friendly surroundings and nearby parks create the perfect environment for quality family time. With the added convenience of 2 nearby bus stops and a one-car garage, public transportation accessibility and vehicle protection are gu
$1,150,000
4 beds3.5 baths1,380 sq ft
645 Baden Ave Unit F, South San Francisco, CA 94080
Discover your new townhome-style condo in beautiful Westborough! This end unit at 1 Appian Way, Unit 713-8 offers 2 bedrooms, 1.5 baths, and a loft perfect for a flexible work-from-home space. With 1130 square feet of living space, this home features laminate walnut floors, renovated baths, a cozy fireplace, private balcony, and vaulted ceilings. The kitchen boasts granite countertops, stainless-steel appliances, and a 1-car enclosed garage with an additional front patio for outdoor space. The HOA includes a spacious clubhouse with fantastic amenities such as a pool, spa, exercise room, indoor court, and various event rooms. Adjacent to lovely Sellick Park, it's the perfect place to walk yo
$719,000
2 beds1.5 baths1,130 sq ft
1 Appian Way Unit 713-8, South San Francisco, CA 94080
Back on Mkt, No fault of the property. This Charming Ground level Condo is located in the desirable Skyline Village Community in the Westborough neighborhood of South San Francisco. This charming corner unit condo with abundant natural light and offers an inviting space that is move-in ready. A cozy living area with open floor plan and a fireplace. A modern kitchen with ample cabinets. Additionally, the convenience of an in-unit washer/dryer and a 1 car covered detached garage (another car with Parking permit) adds to the ease and comfort of everyday living. Westborough Square, Seafood City, King Plaza, Serramonte mall, Costco, and a variety of restaurants are just moments away. With conven
$699,000
2 beds1.5 baths877 sq ft
3550 Carter Dr #111, South San Francisco, CA 94080
Enjoy crystal clear views of the western hills from this extensively refurbished gem! The marble tile entry leads to glorious hardwood floors, vaulted ceilings, and stately fireplace in the living room. Set up your BBQ on the adjacent balcony and take in the sunshine and views. Fabulous all new kitchen w/ LVP flooring, recessed lighting, all new cabinets, quartz countertops, gas range, refrigerator, and microwave. Convenient 1/2 bath upstairs too! Downstairs unobstructed views continue in the master and 2nd bedroom. Enjoy the views from your bed! The bathrooms have been remodeled w/ LVP floors, new fixtures, cabinets, mirrors, lighting, and quartz counters. Double doors lead to a truly spac
Discover the epitome of luxury townhouse living in this exquisite brand-new 4-bedroom, 3.5-bathroom property ideally located just about a mile away from both BART and Caltrain stations, ensuring a stress-free daily commute. With a modern design, laminate floors throughout, quartz countertops, and an island in the kitchen. The balcony boasts some of the best views! This meticulously designed home exudes elegance and sophistication in every detail, while its family-friendly surroundings and nearby parks create the perfect environment for quality family time. With the added convenience of 2 nearby bus stops and a one-car garage, public transportation accessibility and vehicle protection are gu
$1,375,000
4 beds3.5 baths1,611 sq ft
645 Baden Ave Unit D, South San Francisco, CA 94080
Come and see Willow Grand's best unit. This highly desirable top/corner unit has high ceiling and one extra loft office space can be easily converted to the "second bedroom". The kitchen opens up nicely to the living and dining room so that you can stay engaged with your company whilst preparing the new dish you just learned. Retire for the night in the spacious master bedroom with your kids or guests on the second floor provide more privacy. This is just minutes away from Costco and Trader Joe's for groceries. Walkable distance to BART and CalTrain for a quick and easy commute to SF or South Bay.
This delightful 2 level condo with views presents itself in the desirable Westborough neighborhood. Both levels offer fantastic views of the bay and the mountains. There is a spacious living room on the main level with a fireplace, a new wet bar, and a balcony with a view perfect for pleasant evenings and family gatherings. The remodeled kitchen boasts newer appliances and cabinets, while the dining and family rooms are seamlessly connected. The family room can serve as a home office. Upstairs discover a spacious primary bedroom with new double sink vanity cabinets and another private balcony overlooking the view. There are two additional bedrooms, a full bathroom, and a laundry closet. Nea
$849,000
3 beds2.5 baths1,644 sq ft
3550 Carter Dr #148, South San Francisco, CA 94080
Unlock the door to an extraordinary real estate opportunity in South San Francisco. This unique bundle of sale presents a blend of lucrative investment potential, featuring a meticulously crafted single-family home and a collection of 10 modern townhomes. Welcome to a lifestyle where residential elegance meets strategic investment. This sale is including physical addresses of 502, 504,506, 508 Commercial Ave, 508-A Commercial Ave, 101, 103, 107, 109, 111 Spruce Ave and 507 Second Lane. This is your chance to own a distinctive piece of South San Francisco real estate, where residential comfort and investment potential converge.
Welcome to your cozy oasis at 3550 Carter Dr #117, nestled in the highly desirable neighborhood of Westborough in SSF. This light-filled 2bd, 1.5ba condo offers the perfect blend of comfort & convenience, boasting modern amenities & prime location. As you step inside, youre greeted by a bright & airy living room complete with/ a gas fireplace. The living room flows into a cozy dining area that leads to sliding glass doors & a tranquil low maintenance outdoor space. Modern kitchen w/ plenty of cabinet space & an island - perfect for entertaining guests. Two bedrooms w/ plenty of natural light & spacious closets. The full bathroom features a shower over tub
$675,000
2 beds1.5 baths877 sq ft
3550 Carter Dr #117, South San Francisco, CA 94080
Exquisitely remodeled Condominium with garage close to SFO, Bart, Costco, Trader Joes, Kaiser Permanente and Restaurants. This is a Lower Level unit with an Enclosed Shared Garage. Stainless Appliances, Built-in Microwave, Gorgeous Range Hood, Quartz Countertops; Balcony replaced in Nov 2022. LVP Flooring throughout!! Soft Close Cabinets throughout. Remodeled and tastefully furnished in 2021.
Discover the perfect blend of comfort and convenience in this charming 2 beds, 1 bath mobile home. Perched on a coveted corner lot, this home spans a cozy yet efficient 480 SqFt, masterfully designed to maximize both space and style. As you step inside, you're greeted by an open living, dining, and kitchen area, drenched in natural light. The ambiance is warm and welcoming, ideal for both relaxing and entertaining. The heart of the home, the kitchen, is thoughtfully laid out, perfect for culinary adventures. The spacious primary bedroom is a serene retreat, featuring ample room and a dedicated vanity desk area. The cozy secondary bedroom presents the perfect office space for focused work or
$146,000
2 beds1 bath480 sq ft
1700 El Camino Real Unit 17-11, South San Francisco, CA 94080
Offer Accepted by County. Confirmation Hearing will be on 04/25/2024 at 9:00am. County court house 400 County Center Redwood City Ca. Up-Bid opportunity in court begins at $694,550.00. Bidding by interested parties will be permitted as per probate court rules. These condos are seldom available and much sought after. With a Chefs kitchen which includes JennAir gas range and beautiful cabinetry. In unit Laundry and extra office or lounge area make the unit shine with possibilities. Bamboo flooring and Berber carpet really set off the magnificent 180 degree unobstructed bay , city, and peninsula view. Two car parking is included in the secure garage with visitor parking in a separate gated gar
$699,000
1 bed1 bath893 sq ft
1 Mandalay Pl #1209, South San Francisco, CA 94080
Simple living starts here. This rarely available penthouse level condo in the luxurious high-rise offers gorgeous Peninsula views, higher ceilings, fresh interior paint, tile and hardwood flooring, a modern kitchen with newly upgraded LG appliances, recessed lighting, full sized LG W/ D, plus a space for extra storage or a minimalist home office. Building amenities include a controlled-access for security, a grand lobby with high-end finishes, a fitness center, and a social room with a kitchen and a veranda. Nearby parks and hiking trails, Oyster Point Pier, the SSF Biotech hub, Costco, BART, Caltrain, SFO airport, and SSF downtown restaurants and shops. Easy freeway access and EV charging
$812,000
1 bed1 bath893 sq ft
1 Mandalay Pl #1509, South San Francisco, CA 94080
Discover the epitome of luxury townhouse living in this exquisite brand new 4-bedroom, 3-bathroom property ideally located just about a mile away from both BART and Caltrain stations, ensuring a stress-free daily commute. With a modern design, laminate floors throughout, quartz countertops, and an island in the kitchen. The balcony boasts some of the best views! This meticulously designed home exudes elegance and sophistication in every detail, while its family-friendly surroundings and nearby parks create the perfect environment for quality family time. With the added convenience of 2 nearby bus stops and a one-car garage, public transportation accessibility and vehicle protection are guar
$1,350,000
4 beds3 baths1,623 sq ft
645 Baden Ave Unit C, South San Francisco, CA 94080
30 Gardiner Ave is situated on 5, 253 square feet of land and has a gross building area of approximately 3,100 square feet (buyer to verify), offering residents four 2-bedroom and 1-bathroom, and one 1-bedroom and 1-bathroom floor-plans. The property overlooks Oyster Point, the biotech capital of the world, home to top employers such as Genentech and Thermo Fisher. Nearby, tenants can enjoy a hike on the San Bruno Mountain Ridge trail and many others. The investment appeal of this asset is driven by South San Francisco's booming economy and fast-growing biotechnology industry. With a world-class location minutes away from the City of San Francisco, the San Francisco Airport, and quick acces
Three fully tenant-occupied residential apartment units on First Lane. PLUS a tenant-occupied single family bungalow on the parcel with a 633 Commercial Avenue frontage address. Each of the respective rentals are 4 total Rooms plus 1 Bathroom. There are 4 garage spaces associated with the First Lane building. The Commercial Avenue bungalow has 2 tandem carport parking.
Amazing opportunity to live in the prime Downtown South San Francisco neighborhood. This is a 2,751 sqft lot with plans to build a 2 story single family home of 900 sqft with an attached ADU on the lower level of 800 sqft. Main house with plans for 2 bedrooms, 2 bathrooms, 1 car garage, and balcony. The ADU with plans for 2 bedrooms and 2 bathrooms. Blocks away from the middle of downtown, grocery stores, restaurants, and entertainment such as the California Golf Club or large biotech companies. Easy commute just minutes away from 101, 280, BART, Caltrain and the SFO Airport. Whether you are looking to buy and build your dream home with your choices of finishes or use this as an investment
Unlock the potential of this remarkable South San Francisco opportunity. This 3001 sqft vacant lot comes with approved plans for a 1485 sqft 3 bed 2.5 bath main house accompanied by two attached ADUs with separate entrances. For those without a contractor, we've got you covered. A seasoned, local builder is ready to turn your vision into reality. The first ADU offers 421 sqft with 1 bed and 1 bath, while the second ADU offers 351 sqft with 1 bed and 1 bath providing versatile living options and also a great rental income potential. This project has been appraised at $1,885,000 once fully built and construction financing and/or seller financing are available. The location is 5 blocks from do
This area's enrollment policy is not based solely on geography. Please check the school district website for more information.
Elementary schools
Middle schools
High schools
GreatSchools Summary Rating
7/10
Monte Verde Elementary School
Public, K-5
6/10
Buri Buri Elementary School
Public, K-5
6/10
Spruce Elementary School
Public, K-5
6/10
Junipero Serra Elementary School
Public, K-5
6/10
Ponderosa Elementary School
Public, K-5
Only showing 5 of
11 elementary schools.
School data is provided by GreatSchools, a nonprofit organization. Redfin recommends buyers and renters use GreatSchools information and ratings as a first step, and conduct their own investigation to determine their desired schools or school districts, including by contacting and visiting the schools themselves.Redfin does not endorse or guarantee this information. School service boundaries are intended to be used as a reference only; they may change and are not guaranteed to be accurate. To verify school enrollment eligibility, contact the school district directly.
What is the median home price in South San Francisco?
Homes for sale in South San Francisco have a median listing price of $1.1M. Some of these homes are Hot Homes, meaning they're likely to sell quickly.
What are some of the most popular neighborhoods in South San Francisco?
Popular neighborhoods include Central Brisbane, Crestmoor, Sunshine Gardens, Downtown South San Francisco, Westborough, San Bruno Park, Shelter Creek Condos, and Serramonte.
What is transportation like in South San Francisco?
South San Francisco, California boasts a robust transportation system, with a variety of options for residents. The city is served by an extensive public transportation network, including buses and trains, ensuring easy connectivity within the city and to surrounding areas. For those who prefer to drive, South San Francisco experiences moderate to high traffic levels, particularly during peak hours. The city's strategic location provides direct access to several major highways and freeways, making car travel convenient for residents. Learn more on our South San Francisco city guide.
What types of properties are available in South San Francisco?
South San Francisco, California offers a variety of single-family home types, including ranch-style homes, contemporary homes, and modern homes with sleek designs and open floor plans. These homes can be found throughout the city, with some located in established neighborhoods and others in newly developed areas. Most properties feature 3-4 bedrooms and were built within the last 20 years. To explore different property types for sale in South San Francisco, California, use the 'Home type' filter located above the active listings. Customize your search by selecting options like single-family homes, condos, townhomes, and more.
What is life like in South San Francisco?
Living in South San Francisco, California offers a vibrant urban experience with a mix of residential and commercial areas. The landscape is characterized by a blend of modern architecture and natural beauty, including parks and green spaces. The weather is mild and temperate, with cool summers and mild winters. The city provides a range of job opportunities across various industries, from technology and biotech to manufacturing and logistics. Residents can enjoy a variety of recreational activities, such as exploring local trails, visiting art galleries, and dining at diverse restaurants.
What are the schools and amenities like in South San Francisco?
South San Francisco, California, boasts a variety of public amenities for its residents. The city is home to numerous restaurants, offering a wide range of cuisines to satisfy diverse culinary preferences. For those who enjoy the outdoors, there are several parks available for leisure and recreation. Grocery stores are also conveniently located throughout the city, providing easy access to daily necessities. Furthermore, South San Francisco offers additional amenities such as libraries, fitness centers, and community centers, enhancing the quality of life for its residents.
In the past month, 25 homes have been sold in South San Francisco. In addition to houses in South San Francisco, there were also 21 condos, 4 townhouses, and 2 multi-family units for sale in South San Francisco last month. South San Francisco is a moderately walkable city in San Mateo County with a Walk Score of 63. South San Francisco is home to approximately 62,213 people and 44,047 jobs. Find your dream home in South San Francisco using the tools above. Use filters to narrow your search by price, square feet, beds, and baths to find homes that fit your criteria. Our top-rated real estate agents in South San Francisco are local experts and are ready to answer your questions about properties, neighborhoods, schools, and the newest listings for sale in South San Francisco. Our South San Francisco real estate stats and trends will give you more information about home buying and selling trends in South San Francisco. If you're looking to sell your home in the South San Francisco area, our listing agents can help you get the best price. Redfin is redefining real estate and the home buying process in South San Francisco with industry-leading technology, full-service agents, and lower fees that provide a better value for Redfin buyers and sellers.


 REDFIN IS COMMITTED TO AND ABIDES BY THE FAIR HOUSING ACT AND EQUAL OPPORTUNITY ACT. READ REDFIN'S FAIR HOUSING POLICY AND THE NEW YORK STATE FAIR HOUSING NOTICE.
 United States
 Canada