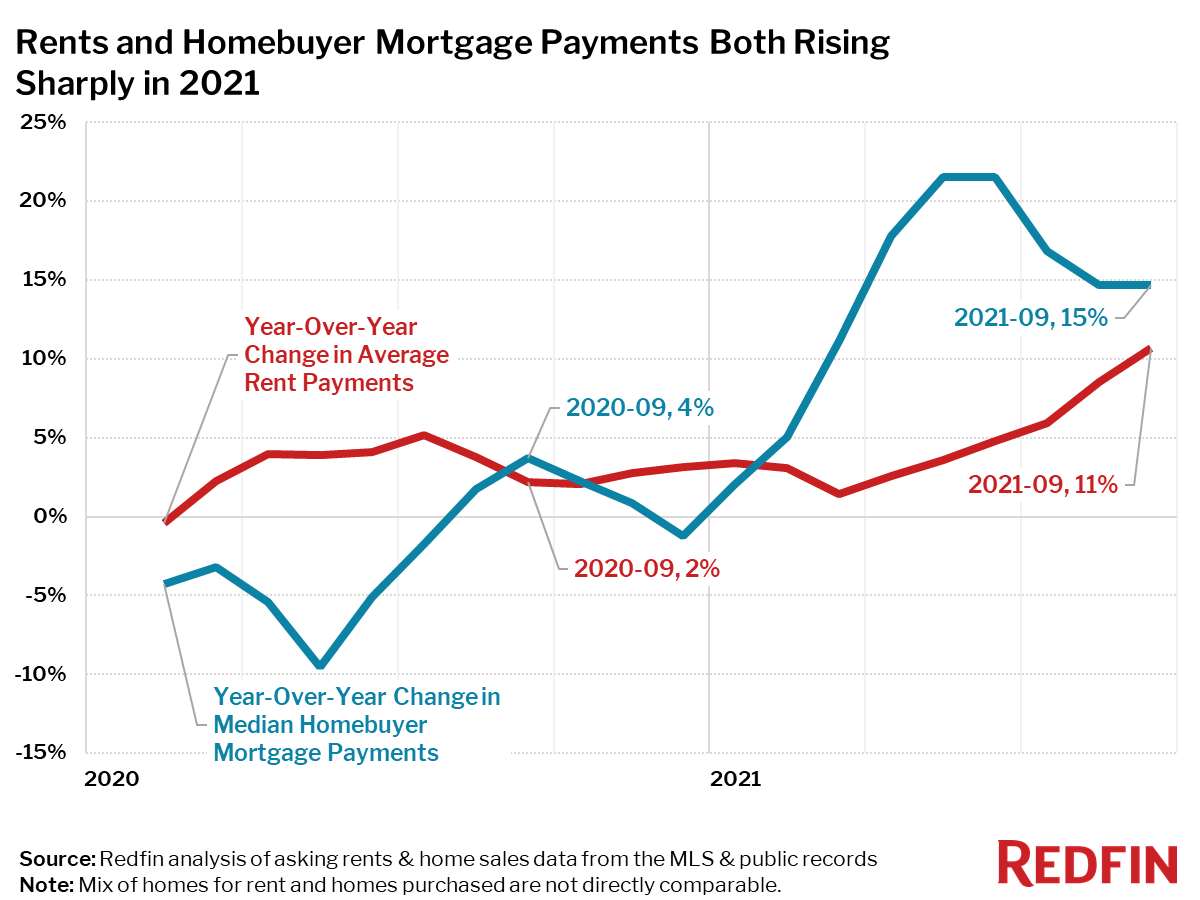
Rents were up 11%, the fastest annual growth in at least two years; mortgage payments for new homebuyers rose 15%.
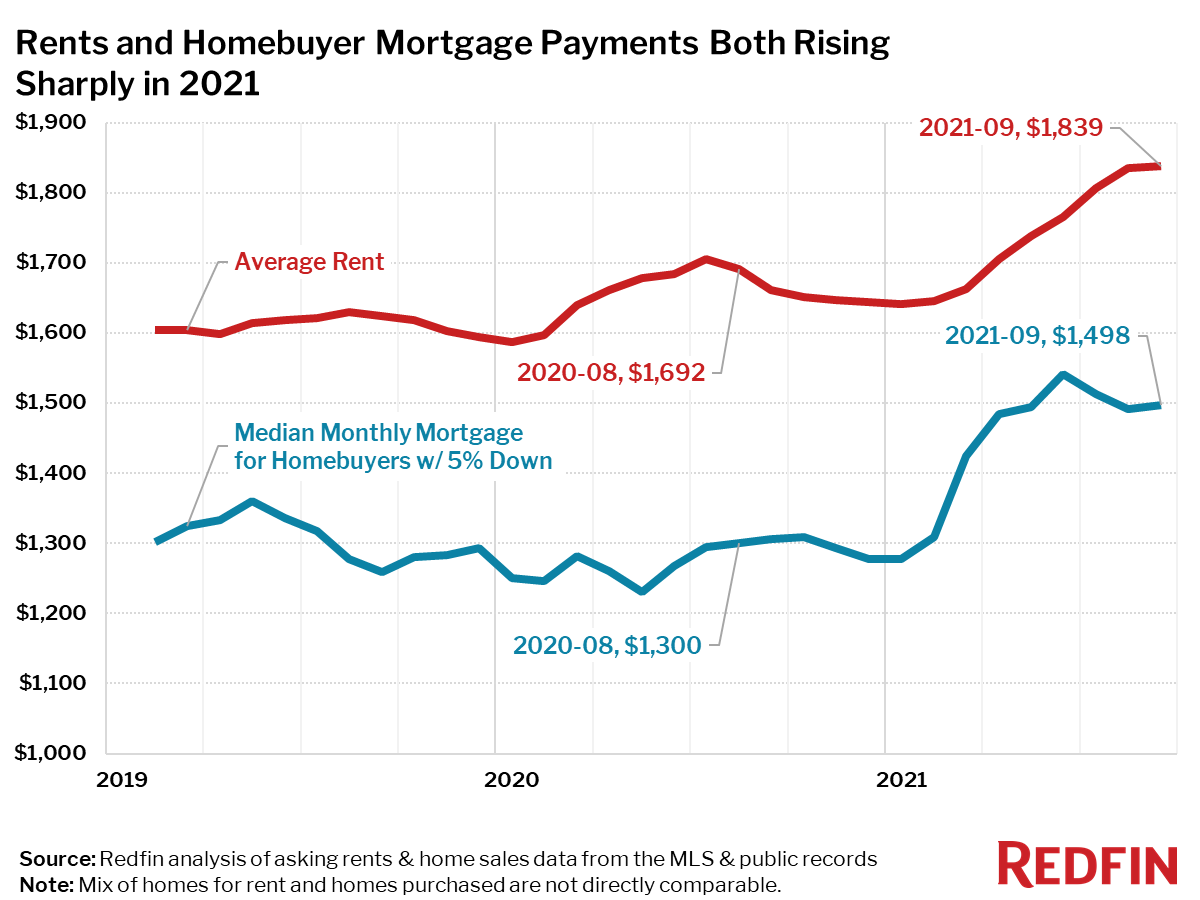
Average monthly rents increased 11% nationwide over the past year, the highest growth rate in at least 2 years. The national median monthly mortgage payment for homebuyers went up even faster, climbing 15% since September 2020. This is the eighth consecutive month that growth in median mortgage payments for new homebuyers has outpaced that of rents.
Rent price increases outpaced mortgage payments for new homebuyers in 26 of the 50 largest metro areas in the US during September.
Redfin’s rent-versus-own analysis uses data from more than 20,000 apartment buildings across the US. The report combines rental data on all sizes of apartments for rent with home sales data on all residential home sales (single-family, townhouse and condos) from public records and the multiple listing service (MLS). When this report refers to the median mortgage payment for new homebuyers, it is based on a 5% down payment, the median sale price during the month and the average mortgage interest rate for the month. The report uses a 5% down payment in order to be comparable to what an average renter may be able to reasonably achieve in savings.
Rents are rising the fastest in Florida
The metro areas with the biggest increases in rent prices were clustered in southern Florida where people have been flocking to escape more expensive metros in the northeast, but some expensive cities like Seattle and New York were also in the top 10. Rents were up the most from a year earlier in Fort Lauderdale, Miami, and West Palm Beach, which all saw rents go up 36%.
“Florida is seeing some of the largest increases in rents thanks to migration from remote workers who previously lived in cities like New York or San Francisco,” said Redfin Chief Economist Daryl Fairweather. “Because out-of-towners typically rent before buying, this migration is likely driving a larger spike in demand for rentals compared to homes for sale. Florida also has some of the highest climate risks in the country from sea-level rise, storms and heat. So renting may be particularly attractive to residents who don’t want to make a long-term bet on the Florida housing market.”
Top 10 Metro Areas With Fastest-Rising Rents
- Fort Lauderdale, FL (+36%)
- Miami, FL (+36%)
- West Palm Beach, FL (+36%)
- Tampa, FL (+34%)
- Seattle, WA (+27%)
- Nassau County, NY (+27%)
- New Brunswick, NJ (+27%)
- New York, NY (+27%)
- Newark, NJ (+27%)
- Orlando, FL (+26%)
Only Pittsburgh saw rents decline
- Pittsburgh, PA (-1%)
Only one metro area saw a decrease in rent in September compared to a year earlier: Rents fell 1% in Pittsburgh, PA. Rents were flat from a year ago in St. Louis, MO.
Only 15 of the 50 largest metro areas saw rents rise more slowly than the 11% national average, including Chicago (+7%) and San Francisco (+6%). In general housing costs across the board are rising much more dramatically in 2021 than in recent years.
Year-Over-Year Change in Rents and Median Monthly Mortgage Payments for Homebuyers, September 2021
| Metro Area | Average Rent | Year-Over-Year Change in Average Rent | Median Monthly Mortgage (5% down) | Year-Over-Year Change in Median Monthly Mortgage (5% down) | Difference Between Year-Over-Year Percentage Point Change in 5% Down Mortgage Payment & Rent |
|---|---|---|---|---|---|
| Anaheim, CA | $3,398 | 13.0% | $3,559 | 15.4% | 2 pts |
| Atlanta, GA | $2,031 | 20.4% | $1,305 | 16.5% | -4 pts |
| Austin, TX | $2,187 | 24.1% | $1,787 | 27.5% | 3 pts |
| Baltimore, MD | $2,103 | 17.2% | $1,344 | 6.4% | -11 pts |
| Boston, MA | $3,646 | 17.3% | $2,393 | 8.2% | -9 pts |
| Charlotte, NC | $1,783 | 11.5% | $1,356 | 16.4% | 5 pts |
| Chicago, IL | $2,419 | 7.4% | $1,166 | 5.9% | -2 pts |
| Cincinnati, OH | $1,349 | 9.1% | $949 | 10.7% | 2 pts |
| Cleveland, OH | $1,411 | 9.2% | $747 | 8.1% | -1 pts |
| Columbus, OH | $1,512 | 9.7% | $1,101 | 13.3% | 4 pts |
| Dallas, TX | $1,953 | 16.1% | $1,483 | 17.3% | 1 pts |
| Denver, CO | $2,489 | 16.3% | $2,096 | 16.6% | 0 pts |
| Detroit, MI | $1,480 | 3.6% | $751 | 15.4% | 12 pts |
| Fort Lauderdale, FL | $2,871 | 36.2% | $1,384 | 14.9% | -21 pts |
| Fort Worth, TX | $1,953 | 16.1% | $1,257 | 20.2% | 4 pts |
| Houston, TX | $1,748 | 10.8% | $1,186 | 14.9% | 4 pts |
| Indianapolis, IN | $1,267 | 9.3% | $989 | 11.3% | 2 pts |
| Jacksonville, FL | $1,667 | 25.1% | $1,238 | 20.5% | -5 pts |
| Kansas City, MO | $1,431 | 1.7% | $1,072 | 4.4% | 3 pts |
| Las Vegas, NV | $1,798 | 24.4% | $1,495 | 19.4% | -5 pts |
| Los Angeles, CA | $3,398 | 13.0% | $3,242 | 12.5% | -1 pts |
| Miami, FL | $2,871 | 36.2% | $1,621 | 15.6% | -21 pts |
| Milwaukee, WI | $1,905 | 19.6% | $1,068 | 10.3% | -9 pts |
| Minneapolis, MN | $1,895 | 6.4% | $1,364 | 10.9% | 4 pts |
| Montgomery County, PA | $2,233 | 12.8% | $1,542 | 8.4% | -4 pts |
| Nashville, TN | $1,810 | 12.0% | $1,542 | 18.5% | 6 pts |
| Nassau County, NY | $3,580 | 26.6% | $2,333 | 12.5% | -14 pts |
| New Brunswick, NJ | $3,580 | 26.6% | $1,700 | 11.5% | -15 pts |
| New York, NY | $3,580 | 26.6% | $2,570 | 13.2% | -13 pts |
| Newark, NJ | $3,580 | 26.6% | $1,839 | 6.8% | -20 pts |
| Oakland, CA | $3,445 | 5.7% | $3,737 | 14.0% | 8 pts |
| Orlando, FL | $2,039 | 26.1% | $1,325 | 18.7% | -7 pts |
| Philadelphia, PA | $2,233 | 12.8% | $1,036 | 7.1% | -6 pts |
| Phoenix, AZ | $2,006 | 22.5% | $1,653 | 26.1% | 4 pts |
| Pittsburgh, PA | $1,603 | -0.7% | $838 | 5.6% | 6 pts |
| Portland, OR | $2,285 | 23.7% | $1,977 | 11.4% | -12 pts |
| Providence, RI | $2,366 | 13.6% | $1,522 | 15.1% | 1 pts |
| Riverside, CA | $2,668 | 21.0% | $1,997 | 15.7% | -5 pts |
| Sacramento, CA | $2,623 | 21.6% | $2,175 | 16.9% | -5 pts |
| San Antonio, TX | $1,259 | 2.7% | $1,186 | 15.5% | 13 pts |
| San Diego, CA | $3,133 | 14.7% | $3,005 | 15.0% | 0 pts |
| San Francisco, CA | $3,445 | 5.7% | $6,089 | 6.3% | 1 pts |
| San Jose, CA | $3,392 | 5.5% | $5,299 | 12.3% | 7 pts |
| Seattle, WA | $2,865 | 26.7% | $2,818 | 12.4% | -14 pts |
| St. Louis, MO | $1,508 | 0.0% | $909 | 7.7% | 8 pts |
| Tampa, FL | $2,090 | 33.6% | $1,265 | 20.4% | -13 pts |
| Virginia Beach, VA | $1,640 | 14.4% | $1,121 | 5.1% | -9 pts |
| Warren, MI | $1,480 | 3.6% | $1,068 | 8.6% | 5 pts |
| Washington, DC | $2,536 | 11.1% | $1,918 | 6.3% | -5 pts |
| West Palm Beach, FL | $2,871 | 36.2% | $1,451 | 14.8% | -21 pts |
| National | $1,839 | 10.7% | $1,498 | 14.7% | 4 pts |
Methodology
Redfin analyzed home sales data from the MLS, and public records and rent prices from RentPath, across the 50 largest metro areas in the US. Monthly rental prices in this report are not directly comparable to monthly homebuyer mortgage payments, since the mix of homes available to rent and the mix of homes being purchased differ in location, size and quality of home within each metro area. For example, most of the homes being purchased may be in the less expensive suburbs of the metropolitan area, while the apartments being rented may be closer to the more expensive city core.
It is also important to note that the prices in this report reflect the current costs of new leases and new mortgages during each time period. In other words, the average rent of $3,343 in the Anaheim metro area is not the average of what all renters are paying, but the average cost of apartments that were available for new renters during August 2021. Likewise, the median monthly mortgage payment of $3,570 in Anaheim was only for homes that sold during the month of August 2021, not for all homeowners.