However, a handful of cities across the country saw rents rise more than 30% from a year earlier, including Miami, Seattle, Portland, OR and Austin.
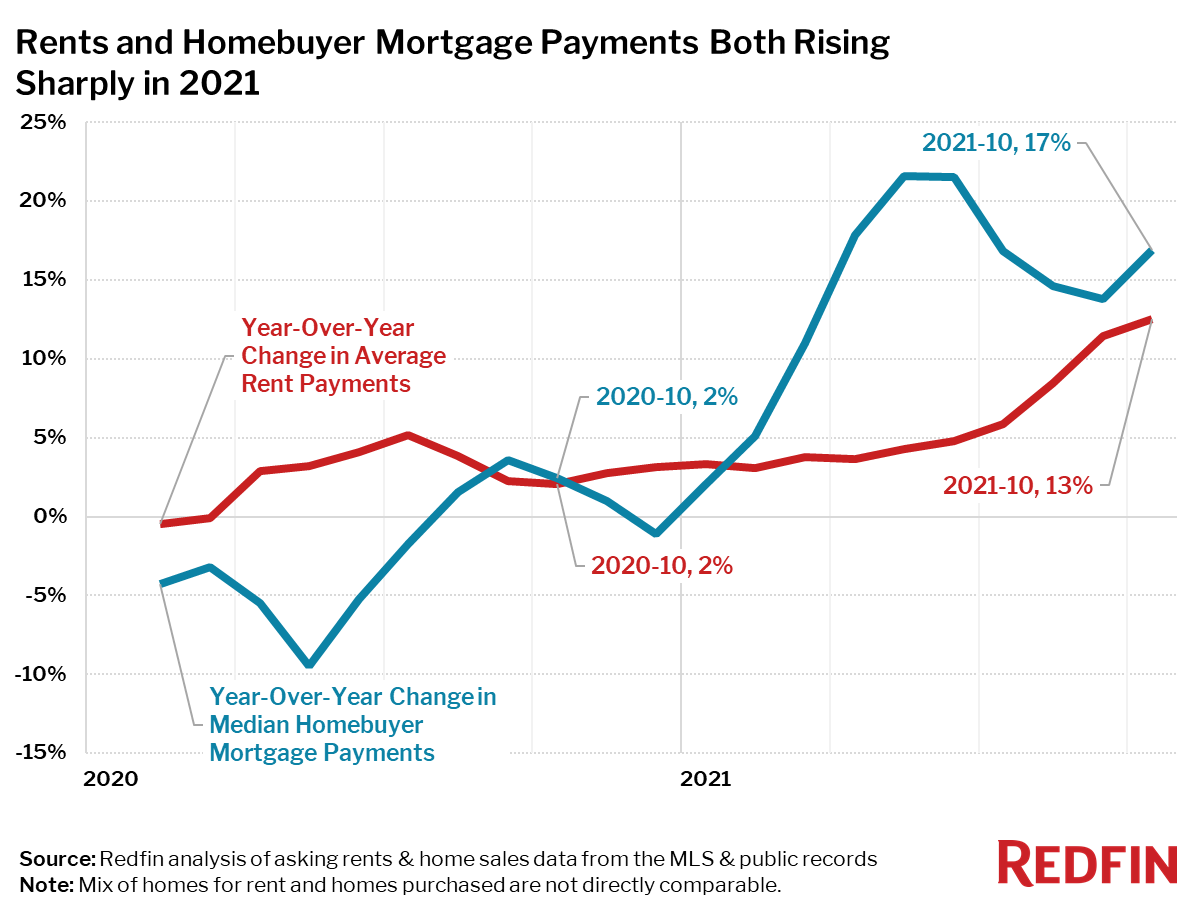
Average monthly rents increased 13% nationwide over the past year, the highest growth rate in at least two years. The national median monthly mortgage payment for homebuyers posted even bigger growth, climbing 17% since October 2020. The 3.2% month-over-month increase in mortgage payments for homebuyers was the largest since April, and more than double the increase during the same period in 2019. Growth rates for mortgage payments and rents had been converging, but an uptick in mortgage rates and home prices caused mortgage-payment growth to accelerate from September to October. The 0.4% month-over-month increase in rents was the smallest in eight months, which could just be a seasonal slowdown or may signal some potential relief for renters.
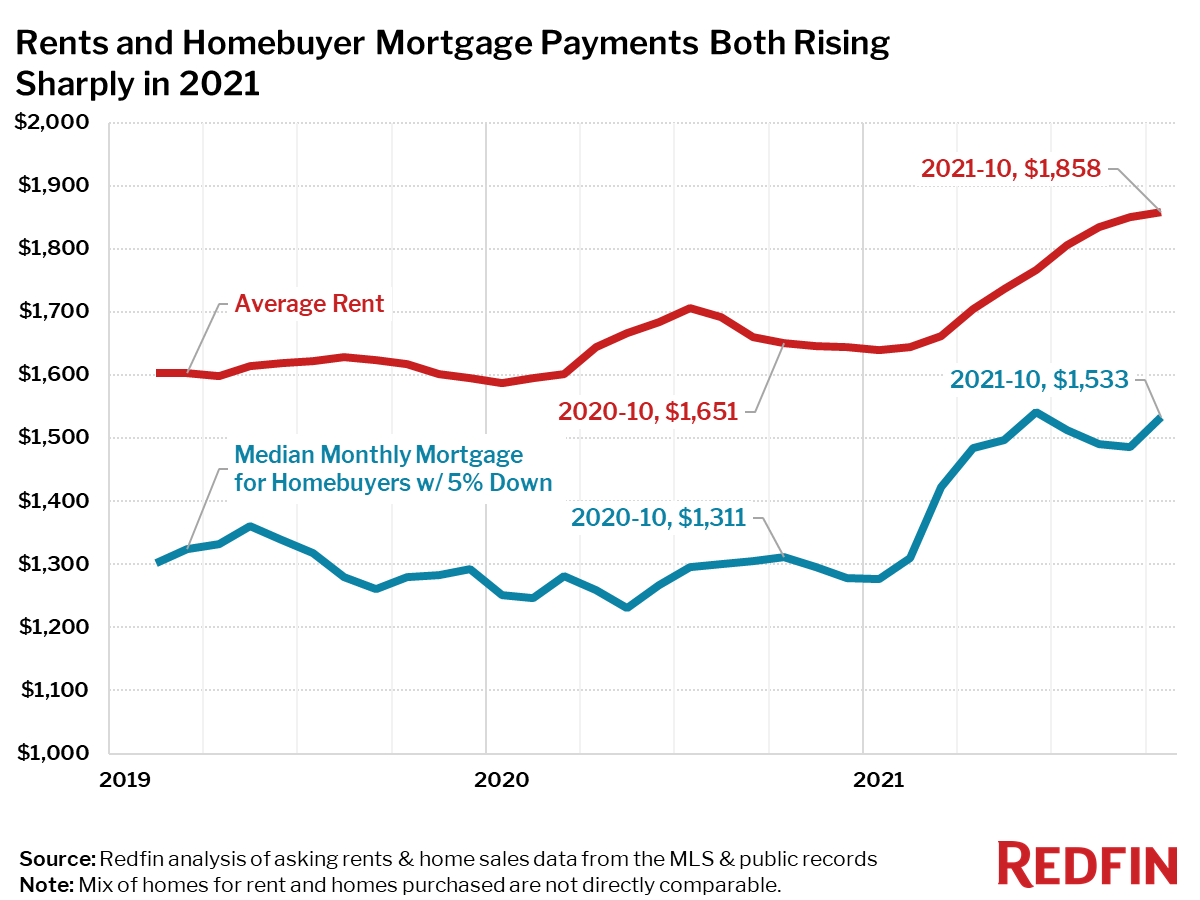
| Rental Market Summary | October 2021 | Month-Over-Month | Year-Over-Year |
|---|---|---|---|
| Average Monthly Rent | $1,858 | 0.4% | 12.5% |
| Median Monthly Mortgage Payment for Homebuyers w/ 5% down payment | $1,533 | 3.2% | 16.9% |
Rent price increases outpaced mortgage payments for new homebuyers in 29 of the 50 largest metro areas in the U.S. during October.
Rents are Up Over 30% In Many Major Metro Areas
The metro areas with the biggest increases in rent prices—up over 30%—were in Florida, Washington State, Oregon, Texas, and New York.
“Fast-rising rents could contribute to inflation woes,” said Redfin Chief Economist Daryl Fairweather. “Employees facing higher rents are likely to demand higher compensation from their employers, which could in turn lead to even more inflation down the line. Skyrocketing rents in some of the most desirable cities suggest that there is an overall shortage of homes, and not just of homes for sale. The ‘Build Back Better’ bill that is currently being debated by Congress contains $150 billion in spending earmarked for affordable housing, which could at least begin to address the issue, but the bottom line is that a lot more housing needs to be built in the places that are growing the most.”
Top 10 Metro Areas With Fastest-Rising Rents
- West Palm Beach, FL (36%)
- Fort Lauderdale, FL (36%)
- Miami, FL (36%)
- Seattle, WA (32%)
- Jacksonville, FL (32%)
- Portland, OR (31%)
- Austin, TX (31%)
- Newark, NJ (31%)
- Nassau County, NY (31%)
- New York, NY (31%)
Only St. Louis saw rents decline
- St. Louis, MO (-4%)
Only one metro area saw a decrease in rent in October compared to a year earlier: Rents fell 4% in St. Louis, MO.
Only 15 of the 50 largest metro areas saw rents rise more slowly than the 13% national average, including Chicago (+11%), Pittsburgh (+7%) and San Francisco (+7%).
Year-Over-Year Change in Rents and Median Monthly Mortgage Payments for Homebuyers, October 2021
| Region | Average Rent | Year-Over-Year Change in Average Rent | Monthly Mortgage (5% down) | Year-Over-Year Change in Monthly Mortgage (5% down) | Difference Between Year-Over-Year Change in 5% Down Mortgage Payment & Rent |
|---|---|---|---|---|---|
| Anaheim, CA | $3,415 | 14.4% | $3,718 | 19.3% | 5 pts |
| Atlanta, GA | $2,036 | 20.9% | $1,384 | 23.1% | 2 pts |
| Austin, TX | $2,235 | 31.1% | $1,859 | 29.0% | -2 pts |
| Baltimore, MD | $2,074 | 18.0% | $1,345 | 7.1% | -11 pts |
| Boston, MA | $3,663 | 23.5% | $2,405 | 11.6% | -12 pts |
| Charlotte, NC | $1,826 | 19.1% | $1,394 | 20.6% | 1 pts |
| Chicago, IL | $2,450 | 11.1% | $1,168 | 9.6% | -2 pts |
| Cincinnati, OH | $1,385 | 15.2% | $964 | 14.4% | -1 pts |
| Cleveland, OH | $1,380 | 6.4% | $768 | 10.7% | 4 pts |
| Columbus, OH | $1,527 | 15.8% | $1,108 | 13.1% | -3 pts |
| Dallas, TX | $1,998 | 23.1% | $1,532 | 21.2% | -2 pts |
| Denver, CO | $2,533 | 19.3% | $2,143 | 16.4% | -3 pts |
| Detroit, MI | $1,533 | 6.3% | $707 | 13.1% | 7 pts |
| Fort Lauderdale, FL | $2,891 | 35.8% | $1,414 | 18.3% | -17 pts |
| Fort Worth, TX | $1,998 | 23.1% | $1,291 | 22.0% | -1 pts |
| Houston, TX | $1,730 | 11.0% | $1,233 | 18.7% | 8 pts |
| Indianapolis, IN | $1,285 | 9.1% | $1,012 | 16.8% | 8 pts |
| Jacksonville, FL | $1,621 | 31.6% | $1,273 | 22.6% | -9 pts |
| Kansas City, MO | $1,406 | 0.1% | $1,091 | 11.2% | 11 pts |
| Las Vegas, NV | $1,789 | 26.3% | $1,556 | 24.1% | -2 pts |
| Los Angeles, CA | $3,415 | 14.4% | $3,273 | 13.6% | -1 pts |
| Miami, FL | $2,891 | 35.8% | $1,637 | 19.3% | -16 pts |
| Milwaukee, WI | $1,973 | 23.6% | $1,051 | 9.0% | -15 pts |
| Minneapolis, MN | $1,891 | 6.8% | $1,374 | 11.3% | 4 pts |
| Montgomery County, PA | $2,247 | 16.5% | $1,576 | 10.8% | -6 pts |
| Nashville, TN | $1,814 | 13.9% | $1,621 | 23.0% | 9 pts |
| Nassau County, NY | $3,665 | 30.9% | $2,364 | 13.8% | -17 pts |
| New Brunswick, NJ | $3,665 | 30.9% | $1,729 | 14.6% | -16 pts |
| New York, NY | $3,665 | 30.9% | $2,627 | 15.6% | -15 pts |
| Newark, NJ | $3,665 | 30.9% | $1,839 | 8.9% | -22 pts |
| Oakland, CA | $3,314 | 6.7% | $3,799 | 18.2% | 12 pts |
| Orlando, FL | $2,039 | 27.8% | $1,394 | 24.8% | -3 pts |
| Philadelphia, PA | $2,247 | 16.5% | $1,051 | 11.8% | -5 pts |
| Phoenix, AZ | $1,976 | 22.1% | $1,718 | 28.9% | 7 pts |
| Pittsburgh, PA | $1,661 | 7.0% | $849 | 8.3% | 1 pts |
| Portland, OR | $2,365 | 31.3% | $2,081 | 17.8% | -14 pts |
| Providence, RI | $2,178 | 5.0% | $1,536 | 17.0% | 12 pts |
| Riverside, CA | $2,650 | 19.0% | $2,069 | 21.4% | 2 pts |
| Sacramento, CA | $2,625 | 24.7% | $2,182 | 16.3% | -8 pts |
| San Antonio, TX | $1,258 | 2.4% | $1,233 | 21.9% | 19 pts |
| San Diego, CA | $3,067 | 12.6% | $3,079 | 19.1% | 6 pts |
| San Francisco, CA | $3,314 | 6.7% | $6,365 | 14.0% | 7 pts |
| San Jose, CA | $3,332 | 9.0% | $5,559 | 14.2% | 5 pts |
| Seattle, WA | $3,012 | 32.3% | $2,930 | 17.7% | -15 pts |
| St. Louis, MO | $1,447 | -3.6% | $889 | 7.5% | 11 pts |
| Tampa, FL | $2,059 | 30.5% | $1,301 | 25.3% | -5 pts |
| Virginia Beach, VA | $1,640 | 17.6% | $1,147 | 10.4% | -7 pts |
| Warren, MI | $1,533 | 6.3% | $1,063 | 12.0% | 6 pts |
| Washington, DC | $2,569 | 16.1% | $1,980 | 9.9% | -6 pts |
| West Palm Beach, FL | $2,891 | 35.8% | $1,532 | 17.7% | -18 pts |
| National | $1,858 | 12.5% | $1,533 | 17.0% | 4 pts |
Methodology
Redfin’s rent-versus-own analysis uses data from more than 20,000 apartment buildings across the US. The report combines rental data on all sizes of apartments for rent with home sales data on all residential home sales (single-family, townhouse and condos) from public records and the multiple listing service (MLS). When this report refers to the median mortgage payment for new homebuyers, it is based on a 5% down payment, the median sale price during the month and the average mortgage interest rate for the month. The report uses a 5% down payment in order to be comparable to what an average renter may be able to reasonably achieve in savings.
Redfin analyzed home sales data from the MLS, and public records and rent prices from RentPath, across the 50 largest metro areas in the US. Monthly rental prices in this report are not directly comparable to monthly homebuyer mortgage payments, since the mix of homes available to rent and the mix of homes being purchased differ in location, size and quality of home within each metro area. For example, most of the homes being purchased may be in the less expensive suburbs of the metropolitan area, while the apartments being rented may be closer to the more expensive city core.
It is also important to note that the prices in this report reflect the current costs of new leases and new mortgages during each time period. In other words, the average rent of $3,343 in the Anaheim metro area is not the average of what all renters are paying, but the average cost of apartments that were available for new renters during August 2021. Likewise, the median monthly mortgage payment of $3,570 in Anaheim was only for homes that sold during the month of August 2021, not for all homeowners.
 United States
 Canada