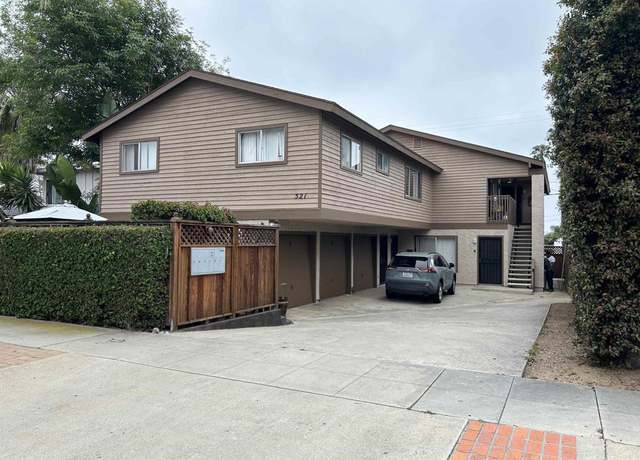
WELL MAINTAINED 5 UNIT BUILDING WEST OF 5 FREEWAY. A BLOCK EAST OF COAST HIGHWAY THE TENANTS ENJOY BEING BLOCKS FROM DOWNTOWN OCEANSIDE, BEACH, SHOPPING, RESTURANTS & MASS TRANSPORTATION . BUILDING CONSIST OF THREE - 2 BEDROOM UNITS AND TWO - 1 BEDROOM UNITS. ALL UNITS HAVE A SEPARATE PRIVATE SINGLE CAR GARAGE. FENCED PRIVATE COMMON PATIO AREA. PRIDE OF OWNERSHIP. THERE'S ADDITIONAL INCOME FROM A SEPARATE 6TH CAR GARAGE & SELLER OWNED LAUNDRY EQ. RENTS BELOW MARKET WITH GREAT UPSIDE POTENTIAL FOR INCEASES.
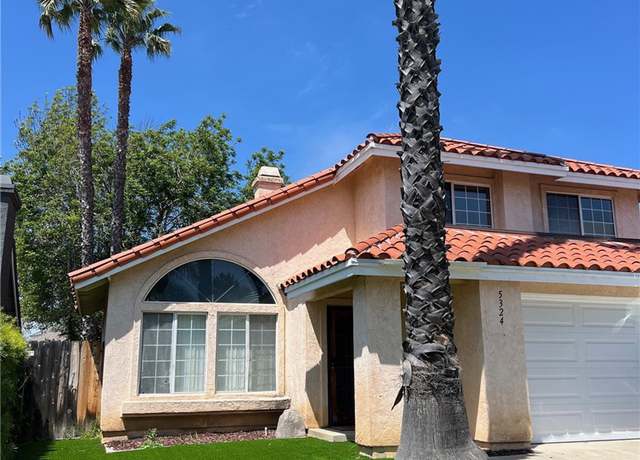
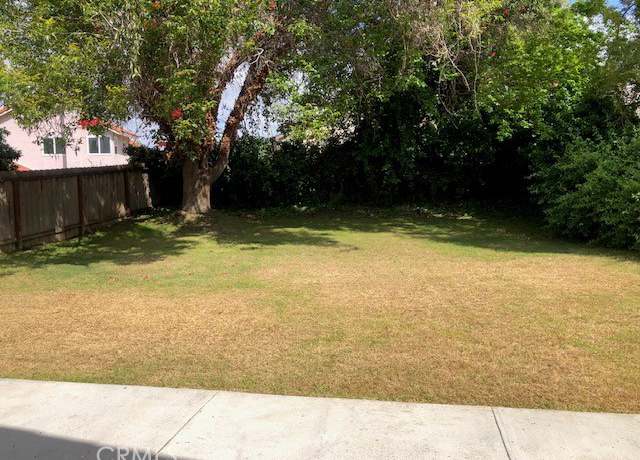
Just a great great house in the super desirable neighborhood of Lakeview Estates! This is a really large premium lot (approx. 6400 sq. ft. ) with total privacy, huge lovely old tree, and pretty much TOTAL peace and QUIET!! The home is just under 1600 sq. ft. with 3 bedrooms - all upstairs, lots of light and neutral everything. .. plus loads of closet space! The downstairs has a spacious formal living and dining room, and a wonderful 'GREAT ROOM' with the family room and kitchen all together! There's a cozy fireplace, a casual dining area, and a cheery open kitchen with new range and beautiful stainless fridge. Lots of cabinet space, 1/2 bath down and direct access to a gigantic garage!
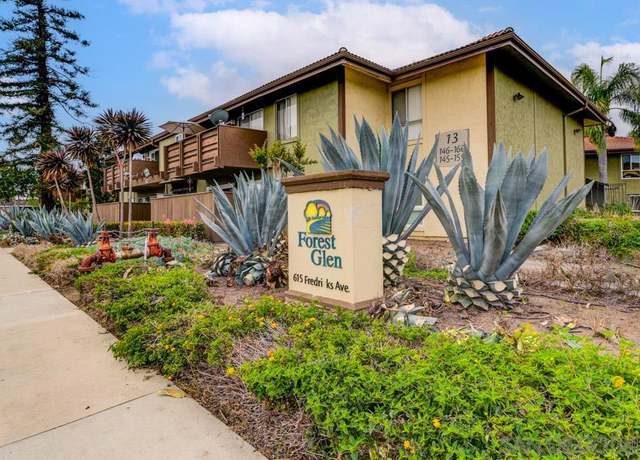
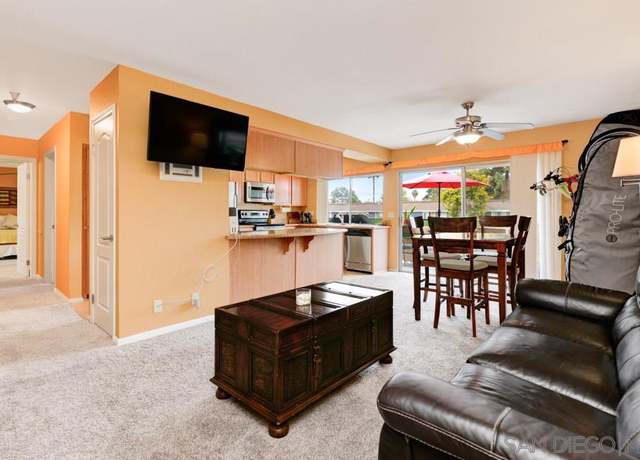
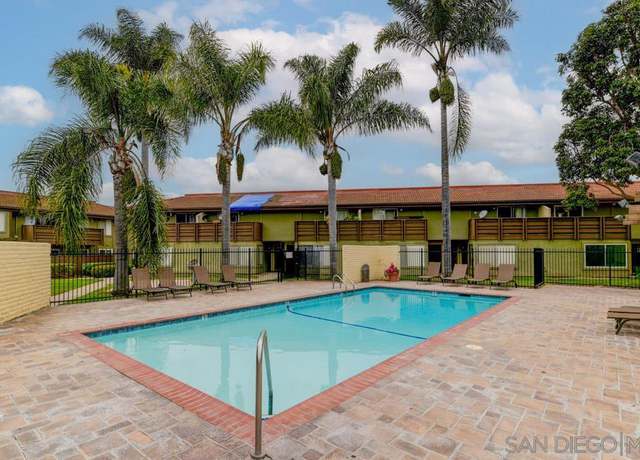
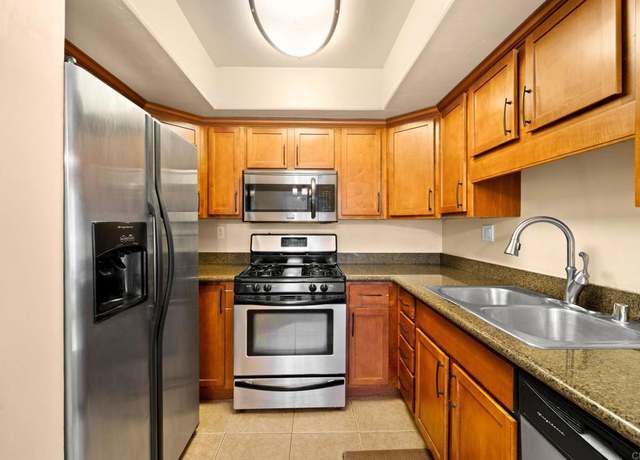
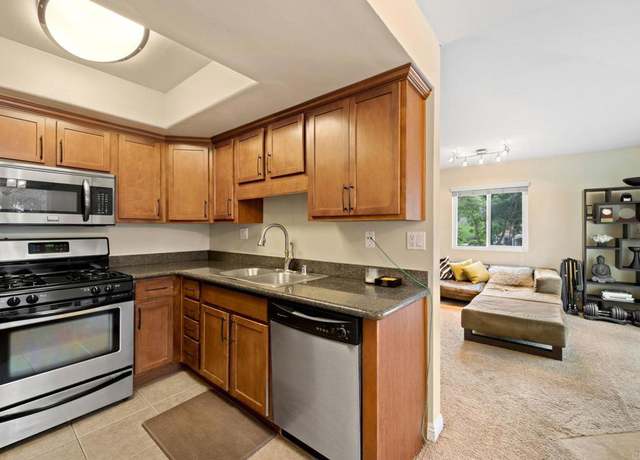
Beautiful Turn-Key 2 Bed 2 Bath condo in the Forest Glen gated community! This stunning condo boasts stainless steel appliances, newer carpet, and is freshly painted! Featuring open concept living, an in-unit washer/dryer combo, a breezy balcony, and tucked away on the 2nd floor in a nice and tranquil area within the complex, this has what you are looking for. The beautifully maintained complex is VA approved and has a large community pool plus assigned covered parking for your unit. Pets are allowed with restrictions so bring your 4 legged friends! Convenient Oceanside location with easy access to the 76, shopping, restaurants, and less than 15 minutes to Downtown Oceanside and Camp Pendle
Discover the allure of modern living in this immaculate 2-bedroom, 2-bathroom condo nestled in the heart of Oceanside, California. Located in the vibrant community of Oceanside, this condo offers easy access to urban conveniences, serene landscapes, and a myriad of recreational opportunities. Indulge in resort-style amenities within the HOA, including a refreshing pool for sunny days, a designated BBQ area for outdoor gatherings, and a clubhouse for socializing with neighbors. Pet-friendly perks abound with a dedicated dog park, while the lush picnic area provides a charming backdrop for al fresco dining and leisurely strolls amidst meticulously landscaped grounds. In addition to these amen
Beautiful detached 2 bedroom, 2 bath, 1498 sqft condo with 2 car garage nicely situated on the edge of the Emerald Isle Golf Course. This well-maintained Oceana home has plenty of windows providing an abundance of natural light. one of its many features is the private atrium patio great for entertaining or creating your own private oasis. There is also a large den/office, plus an extra sitting room off the living room with SW views. and don't forget the ample closet space, and a 10-minute drive to the beach and harbor.
Discover the allure of coastal living at 2401 Maravilla Way— Charming two-story residence nestled in the vibrant and sunny locale of Oceanside, California! Rarely available and freshly upgraded to offer a move-in ready experience with the largest floor plan in this fantastic community. Boasting four spacious bedrooms and two full bathrooms on the upper level and your large primary suite with generous west-facing windows welcoming the gentle ocean breezes. As you step in, you'll love the light filled open-concept across the modern, bright kitchen featuring newer appliances, elegant countertops, custom cabinetry, and a delightful garden window for your herb collection. The living room g
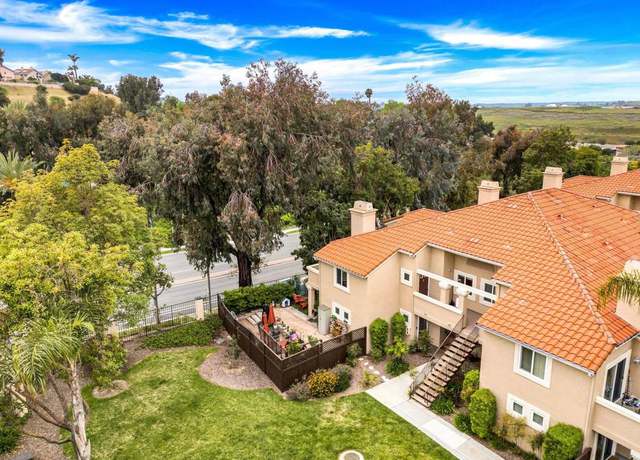
This is a townhome that feels like a house! Set in the wonderful Bay Shores community in Oceanside, this home includes a 2-car garage and a private yard that leads into the kitchen. There are 2 spacious bedrooms with a full bathroom upstairs and a half bathroom downstairs. Both bathrooms have been upgraded with fresh paint, new light fixtures, and vanities. The bedrooms, living room, stairs and hallway have new carpet and the downstairs floor has beautiful wood-like tile for a modern look. The home conveniently has laundry hookups in the kitchen.
Introducing 3533 Cockatoo Court, your retreat in the heart of Oceanside. This spacious residence offers an unparalleled blend of space and sophistication with 3 bedrooms plus a bonus room, 2 full bathrooms, and a convenient half bath across 3,136 square feet of living space. Step inside to discover an additional office space, perfect for work or creative pursuits. The expansive family room beckons for cozy gatherings or quiet evenings spent unwinding. Outside, a sprawling half-acre lot awaits, offering endless possibilities for outdoor enjoyment in the large fenced backyard, complete with a jungle gym for little ones. Nestled within the coveted Wilmont Ranch neighborhood, just minutes from
This beautiful 2023 Golden West Golden Pacific is a brand-new home that features two bedrooms and one bathroom. It is situated in the all-age, land-leased community of Terrace Gardens. The house boasts a spacious floor plan with 9' side walls and a flat ceiling. It also has a coffered ceiling in the living room and pendant lights throughout the home. The kitchen is equipped with stainless steel Whirlpool appliances, Avonite Gulf Coast countertops, an under-mount stainless steel sink, and Classic white cabinets. Terrace Gardens is conveniently located near various shops, restaurants, and entertainment venues. This lovely home is a must-see! For information about the monthly space rent, pleas
(Interior photos to load Friday 4/26) Welcome home to this beautiful VIEW-property in the highly-coveted Mira Costa Mesa neighborhood on the border of Oceanside & Carlsbad. Feeding into the CARLSBAD SCHOOL DISTRICT, this extensively remodeled home underwent a huge 2007 renovation with over $250,000 in upgrades and designer finishes. Every detail exemplifies a commitment to luxury living. The perfectly landscaped front beckons you in as the custom designer exterior paint further demonstrates the first of many elevated design experiences. Step inside to a great room flooded with natural light, vaulted ceilings and views straight past your stunning resort-style backyard. Living like a tr
Henie Hills GEM!! This immaculate & private single level home sits at the end of a cul-de-sac on . 44 acres! NO NEIGHBOR BEHIND - as the property backs up to a small canyon. Once you enter, you're greeted with a view thru the atrium to the OPEN backyard. The beautifully upgraded kitchen features leathered granite countertops with a chiseled edge, center island, custom Knotty Alder wood cabinets, wet bar, breakfast nook & coffee bar, under cabinet lighting, stainless appliances and a stand up bar! The kitchen is open to the family room, complete with a custom stone fireplace & mantel. From the family room, you have access to a fabulous & peaceful covered outdoor livi
Priced in a range between 589-609k. Welcome to your coastal retreat in Oceanside by San Luis Rey River trail while close to the beach as well. Located in the popular Brisbane community, this move-in ready home offers convenient one level living with plenty of natural light, a spacious open floor plan with private balcony, indoor laundry, a cozy fireplace, and an attached garage with extra parking space. The complex features a pool and spa, a dog run/park area, play structure and in close proximity to restaurants, coffee shops, retail shopping, and parks. This is an amazing opportunity to own a rarely available end-unit in an amazing location. The interior was repainted and recently replaced
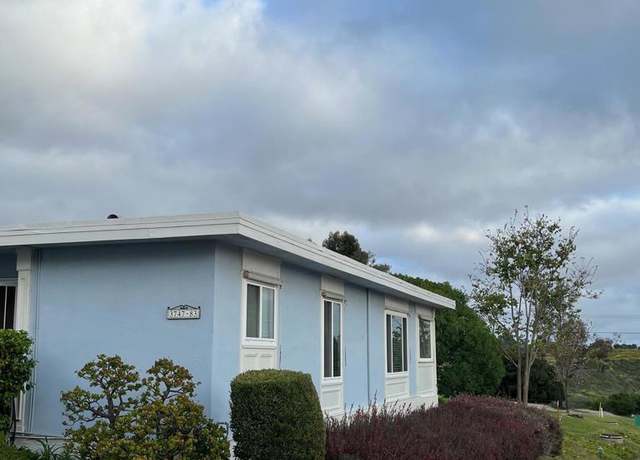
Stunning Remodel less than 5 miles from the Beach! 2bed/2bath located in lovely Senior mobile home community with a LOW LAND-LEASED space on RENT CONTROL and NO PROPERTY TAXES. Huge corner lot with room to enjoy the ocean breezes and birds singing. The main sq footage of the home is 1040, with an additional 312 sq ft of beautifully updated family room/den and an office PLUS a large walk-in closet/storage off the primary bedroom. This fabulous kitchen has gorgeous Granite Countertops, stylish newer Cabinetry, Stainless Steel Appliances, and open floor plan. Other recent upgrades include: hardwood flooring, drywall, New HVAC unit, French Doors to office, Exterior Paint, Window Blinds, Plantat
Are you ready to see a home on one of the best view streets in Fire Mountain? This Split-level beauty has been completely remodeled with over $300K in upgrades, featuring a meticulously landscaped front and backyard with a peek a boo ocean view and Mountain views from the back. As you enter the front door you will notice a brand new Trex Deck porch leading into a generous entry way. Enjoy an open living space where it's easy to cook, spend time with family and friends and have ample seating space for parties or family time together. Upgrades in the living room include bamboo flooring, a tiled fireplace with custom grate and marble hearth, and in ceiling surround sound speakers. The homeowne
Welcome to this charming Wanis View Estates home that has been thoughtfully upgraded with paid solar featuring 18 panels, LG Back up Panel, New Electric HVAC with gas backup, and a tankless water heater. Enjoy the convenience of a Halo water filtration system and QuietCool Whole house fan. This 6 bedroom, 3 bathroom home boasts fresh paint inside and out, new turf, succulents, and landscaped grounds. The main level offers an open floor plan seamlessly connecting the kitchen, dining room, and family room - perfect for entertaining or daily living. A downstairs bedroom and full bathroom provide convenience, while the dining room features a cozy fireplace and custom built-in cabinetry. The spa
Welcome to TURNKEY & CHARMING, SINGLE STORY in Oceanside! Open floor plan, new high-quality real hardwood flooring, UV-resistant windows, granite countertops, ceiling fans & lighting, fresh painted interior, and recently remodeled Kitchen & bathroom with modern finishes. Additional features include new appliances: oven, dishwasher, microwave & fridge! NO HOA! CENTRALLY LOCATED in a quiet neighborhood on a private upper street. Perfect for spending the summer outdoors entertaining and NO DIRECT NEIGHBORS BEHIND. This property is definitely a MUST SEE!
Step inside this beautifully updated single-story, 3-bedroom, 2-bath home, featuring solid surface floors throughout and a large yard. The formal foyer leads to a living room flooded with natural light. The kitchen boasts granite counters, stainless steel appliances, a free-standing island with seating, and a window overlooking the yard, complemented by a spacious dining area. The primary bedroom has views of the stunning landscape has a spacious closet and an en-suite bathroom. Two additional bedrooms with ceiling fans and a second full bathroom complete the floor plan. Outside, you will find an expansive patio and BBQ area surrounded by mature fruit trees and lush greenery. Additional ame
Welcome home to tranquility and luxury within the esteemed Arrowood Golf Community. Situated on a serene cul-de-sac, this meticulously crafted residence epitomizes Oceanside living at its finest. As you enter, a sense of sophistication envelops you, accentuated by an open and inviting floorplan. The interior boasts a harmonious blend of newer luxury vinyl plank, tile, and carpet flooring, setting a tone of elegance throughout. The remodeled kitchen beckons to indulge culinary passions with gleaming leathered marble countertops, marrying functionality with aesthetic appeal seamlessly. Escape to the lavishness of the primary bathroom remodel, featuring a spacious walk-in shower and custom clo
Welcome to your serene retreat in an active 55+ community! This charming unit boasts Pergo laminate flooring, an updated kitchen, and ample living space. Step outside to your lovely backyard oasis with overlooking views or your quaint private courtyard, perfect for peaceful relaxation. Dive into the community's array of amenities, including solar-heated pool, a jacuzzi, and clubhouse. Embrace the active lifestyle with a variety of organized activities and events. Don't miss out on this opportunity to live your best life in this vibrant community!
Welcome to this charming two-bedroom home nestled in the sought-after Orchard Lane community. Recently updated, this residence boasts luxurious vinyl plank flooring and freshly painted interiors. Notable features include plantation shutters, central air conditioning, and an upgraded bathroom. The generous layout encompasses living and dining areas, along with a dedicated laundry room. The kitchen has been renovated and includes a refrigerator. Cathedral ceilings in the main living area enhance the feeling of spaciousness. Parking convenience is provided by a one-car garage, while outdoor relaxation awaits on the large private patio. Residents have access to community pools and spas in a Mel
55+ sanctuary offers stunning canyon views and a meticulously remodeled backyard, creating an oasis of tranquility. Step outside to find seclusion, a tranquil canyon, inviting refreshing breezes, lush landscaping, majestic palm trees, an organic lawn with raised beds, and greenhouse enclosures—perfect for cultivating vegetables, crops, herbs, and flowers year-round. Delight in the abundance of a new orchard of avocado, pear, guava, orange, grapefruit, blueberry, blackberry, strawberries, artichoke, passion fruit, mint, onions, flowers, and herbs. A beautiful lush lawn that takes 10 minutes to trim, electric lawnmower is included. The spacious covered patio, illuminated by skylights, e
Welcome home to Oceanside's coastal charm. Just moments from the sun-kissed shores of Oceanside, where homeownership dreams become reality. Nestled within the privately gated, vibrant Cornerstone Community, this charming 4-bedroom, 2 full bath, 2 half bath condo invites you to experience the best of coastal California living. Laminate flooring guides you through the main level, where a sleek stainless steel kitchen awaits, complete with quartz countertops. The natural light throughout the room and private balcony offer a relaxing place to end or start your day. Upstairs, plush carpeting leads you to three spacious bedrooms, each offering a tranquil sanctuary for rest and rejuvenation. The m
* * Showings by appt after open house on Sunday Apr 28 * * Bright Open Floor Plan, Single-Story home! Carlsbad School district! Calavera Hills area. Large well cared for back yard with playscape, solar heated above ground pool with adjoining deck with a peek ocean view. Spacious kitchen with granite counters, big island, double ovens and gas cooktop. Primary bedroom boasts a huge 9x9 walk in closet. Hardwood and tile flooring through out. New 2020 central air conditioning and furnace. New roof in 2019. Mature fruit trees. Separate laundry room. Wood burning fireplace. Plenty of storage inside and out. RV parking with 220 hook up also for electric car charging. Built-in cabinets in gara
Beautifully renovated single-level twinhome in the desirable 55+ community of Pacifica!! In close proximity to many of the amenities this active adult community offers: heated pool/spa, shuffleboard, 2 tennis/pickleball courts, horseshoe pits, bbq/picnic area, neighborhood park with benches and numerous walking trails. There is also a community clubhouse with billiards, TVs, fully equipped kitchen and library. This absolutely Stunning Home is completely renovated! 2 bedroom 2 bath home with an open floor plan features a remodeled Kitchen with new shaker style cabinets, Quartz counter-tops, new stainless steel appliances, luxury vinyl plank flooring, updated bathrooms, dual pane windows, new
This recently renovated home, nestled in the peaceful cul-de-sac of the highly sought-after Rancho Del Oro neighborhood, is a true gem. Boasting 5 bedrooms and 3 bathrooms, it seamlessly combines sophistication with comfort. The formal dining and living spaces, alongside a spacious family room, provide ample room for relaxation and entertainment. Dual cozy fireplaces grace both the family room and living room, adding to the inviting ambiance. Vaulted ceilings and expansive windows flood the interior with natural light, enhancing its welcoming atmosphere. A downstairs bedroom and bathroom offer convenience, ideal for guests or a home office. Step outside to find a tranquil and private backya
Prominent corner lot location set above the street and with large back and side yards. Generously sized family/living rooms alongside a kitchen that is open to all. Convenient entry level primary suite with large bath area and walk-in closet. One additional bedroom and bath on first level. The second level is comprised of two bedrooms, a multiuse area & full bathroom. Some of the home's key amenities include; newer windows/roof/water heater/washer/dryer/water softener and useful craft room or home office located within the garage. All this and more located close to all the great shopping, dining, beaches and schools offered within the Oceanside area.
LOCATION! LOCATION! LOCATION! This beautiful three-bedroom turnkey home is located approximately 1.6 miles from the beach, minutes to multiple freeways, and a quick drive to a variety of restaurants, shopping, and parks. Completely renovated with top notch upgrades compared to any other unit within the complex. Featuring beautiful white quartz countertops in the kitchen and the bathrooms, custom cabinets, stainless-steel appliances, new lighting, flooring, and dual pane windows. This home underwent a complete floor to ceiling renovation. Bask in the natural light flooding in from the windows and the large French doors which open to the balcony overlooking the pool and tennis courts. Relax i
Centrally located in the heart of Rancho Del Oro, this stunning Mira Costa residence is a prime location with no HOA! This pristine home is in close proximity to shopping, dining, the beach and walking distance to elementary school. Nestled in a quiet and private cul-de-sac with ample parking, the thoughtful design seamlessly combines comfort and functionality. This stunning home's inviting atmosphere emanates throughout, and reflects a true pride of ownership, with no expenses spared. Extensive upgrades include, owned solar, milgard dual pane windows, pex plumbing, AC, furnace and ducting, re-insulated attic, whole house fan, rain gutters, Bluetooth irrigation, security system, custom cabi
Location, location, location! Welcome to this updated 2-bedroom, 1.5-bathroom condo offering a unique blend of coastal charm and convenience. Nestled near Downtown Oceanside, just over 1.5 miles from the beach, it's ideal for anyone who loves the beach and all the fun activities that come with it. This property features a spacious living room with a cozy fireplace, an updated kitchen with butcher block countertops, stainless steel appliances, a convenient breakfast bar area, and a separate dining area. Additional features include an extra-long wall pantry with office cabinet space under the staircase, LVP flooring, updated bathrooms, custom paint, and much more. Enjoy coastal breezes from t
SPECTACULAR PANORAMIC VIEWS from this private estate in the highly desirable area of Morro Hills! This custom built, single level, 3,183 sq ft main home features leased solar, a guest house, swimming pool and spa. Nestled on 5.5 acres, this amazing property features a long private driveway through a mature lime grove. Pick avocados, persimmons, and multiple other citrus fruit. This home features 3 bed, 2 ½ baths, a game room/office space, and two separate living spaces. Beautifully remodeled kitchen is complete with a large island, solid cabinets with tons of storage, quartz counters, and stainless-steel appliances. The kitchen has a large breakfast nook and opens into a grand d
PRIMARY BEDROOM AND SECOND BEDROOM AND BATHROOM ARE ON 1ST FLOOR! Sensational home in the highly sought after gated community of Ocean Terrace. This charming home has an abundance of natural light pouring in from the many large windows in both the living room and primary bedroom. The deck adjacent to the upstairs bedroom/loft has endless gorgeous greenbelt views. VERY PRIVATE BACKYARD! No neighbors behind you. Walk or bike ride to Lake Calavera Preserve, which is composed of 260 acres of nature trails for hiking and biking. Just minutes from shopping, restaurants and the beach, this home and neighborhood are sure to impress!
Welcome to your coastal paradise 8 miles from the beach (with VA ASSUMABLE 3.37%). This charming single-story gem offers the quintessential Oceanside lifestyle, boasting 4 bedrooms, 2 baths and an inviting atmosphere for the whole family. Nestled in a tranquil and family-oriented neighborhood, this move-in ready home is situated on an expansive 7200 sqft lot with NO HOA, this home is a sanctuary of space and serenity. Step outside to discover the meticulously landscaped front and backyard, complete with a delightful patio area perfect for hosting gatherings or simply enjoying the coastal breeze. Inside, modern comforts await with a 5.6kW Solar System ensuring energy efficiency, along with c
This exquisitely remodeled single-story gem is absolutely stunning! It feels like home, with the vaulted ceilings and dual-paned vinyl windows creating an inviting ambiance throughout. Enjoy luxury living with 4 bedrooms, 2.5 baths, and 2 living areas incorporated into an open-concept floorplan with plenty of space for relaxation and entertainment for years to come. The dream kitchen is a chef's paradise, boasting brand-new stainless steel appliances, quartz countertops, and custom shaker soft-close cabinets and drawers. The newly installed flooring ties everything together seamlessly. Enter the lavish primary suite, a haven of tranquility with a spacious en-suite bathroom f
WELCOME TO DUNHILL CT! Discover the perfect blend of comfort and convenience at this beautifully maintained home, ideally located just minutes from the pristine beaches of Oceanside. This residence features three spacious bedrooms, two well-appointed bathrooms, and a flexible bonus room that can effortlessly be transformed into a fourth bedroom or a private home office. Step inside to find a welcoming interior that boasts an open layout, creating a seamless flow throughout the living spaces. The heart of the home is adorned with natural light, highlighting the meticulous care that has been invested in its upkeep. Car enthusiasts or hobbyists will appreciate the expansive three-car garage, p
Welcome to the coveted community of Sea Vista. This meticulously crafted home offers a spacious layout bathed in abundant natural light, creating an inviting ambiance throughout. Step into the well-appointed kitchen, where the backyard Ocean Views beckon, providing a picturesque backdrop that extends towards the coastline. Designed for low-maintenance living, this home comes with Owned Solar. Ascending the stairs, you'll discover all bedrooms thoughtfully situated on the upper level. The primary bedroom treats you to breathtaking ocean views. Venture outside to the meticulously landscaped backyard, a haven of relaxation boasting mature greenery and ocean views. Enjoy being close to schools,
Better than brand new! This 1 BD/1BA beach home has been completely re-built inside and out. New plumbling, wiring, windows and driveway with parking for 2 cars. Inside all new with living room add on with drywall, skylight and LED canned lights. Complete kitchen remodel. New appliances, electric induction stove top, exhaust fan, dishwasher, LG refrigerator/freezer, plus a brand new washer/dryer combo! Remodeled bath with tile shower. Newly painted interior and exterior and roof re-sealed. Drip water system for outdoor plants. Mira Mar is a 55+ gated community just above the beach and harbor in Oceanside and just blocks from downtown with all the amenities you will ever need. Walk everywher
Stylishly updated, turnkey 3 BR 2.5 BA home in Ocean Hills! This property is situated in a nicely landscaped community of single family homes walking distance from Rancho Buena Vista High School! Upgrades include hardwood floors throughout, modern bathroom tile and vanities, stainless steel kitchen appliances and farm sink. The spacious and private backyard with market lighting is large enough to add a pool. The two-car garage is has plenty of room for your vehicles, tools and outdoor gear. This gem won’t last long - priced at less than $1M it is an incredible value in a great family-friendly community.
Enjoy an unparalleled lifestyle in this remarkably remodeled home situated amidst the exceptionally maintained grounds of Ocean Hills. The kitchen offers charm and elegance with brand-new stainless steel appliances, quartz countertops, and custom shaker soft-close cabinets. Gorgeous new flooring throughout creates a clean and seamless transition from room to room. Appreciate the natural light with vaulted ceilings and vinyl dual-pane windows, which create a tranquil sanctuary. Retreat to your lavish primary suite, featuring a spacious en-suite bathroom with dual vanities, a large walk-in closet, and a designer-tile walk-in shower. Additionally, this home features a loft that could be easily
Escape to tranquility in the peaceful, tree-lined Whelan Ranch community. This beautiful move-in ready condo has everything you could ever ask for. From the moment you walk in you will immediately notice the open floor plan guiding you effortlessly from the living, dining, and kitchen spaces. On days where you find yourself wanting to enjoy the California sunshine you can barbecue on your large private patio, where you can walk right in and enjoy direct access to the downstairs area. As you head upstairs you'll be greeted by a generously sized primary bedroom - a perfect place to settle down after a long day. This home includes direct access to the laundry room and your own private gar
Welcome to 119 Mayfair St. ! This stunning remodeled home offers 4 beds, 3 baths, and 1,750 sq ft of spacious living. With an open floor plan, stainless steel appliances, and two primary bedrooms with ensuites, this property is a dream come true. Enjoy the covered patio and greenhouse in the backyard. The 2-car garage provides ample parking and storage. Located in a desirable neighborhood. Don't miss out on this rare luxury and value. Schedule a showing today!
This area's enrollment policy is not based solely on geography. Please check the school district website for more information.
Elementary schools
Middle schools
High schools
GreatSchools Summary Rating
10/10
Magnolia Elementary School
Public, K-5
9/10
Casita Center For Science/math/technology
Public, K-5
8/10
Buena Vista Elementary School
Public, K-5
8/10
Calavera Hills Elementary School
Public, K-5
8/10
Bonsall West Elementary School
Public, K-6
Only showing 5 of
30 elementary schools.
School data is provided by GreatSchools, a nonprofit organization. Redfin recommends buyers and renters use GreatSchools information and ratings as a first step, and conduct their own investigation to determine their desired schools or school districts, including by contacting and visiting the schools themselves.Redfin does not endorse or guarantee this information. School service boundaries are intended to be used as a reference only; they may change and are not guaranteed to be accurate. To verify school enrollment eligibility, contact the school district directly.
Homes for sale in Oceanside have a median listing price of $875K. Some of these homes are Hot Homes, meaning they're likely to sell quickly.
What are some of the most popular neighborhoods in Oceanside?
Popular neighborhoods include Downtown Oceanside, Carlsbad Village, Calavera Hills, South Oceanside, Oceana, Ocean Hills, Olde Carlsbad, Ivey Ranch-Rancho del Oro, Fire Mountain, and Mira Costa.
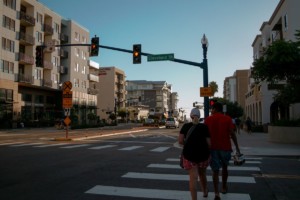
Oceanside, California boasts a well-connected transportation network, with options for both public and private commuting. For those who prefer to drive their car, traffic levels can be high during peak hours, especially on weekdays. Public transportation is available in Oceanside, with the North County Transit District offering bus and train services throughout the city. Additionally, Oceanside is conveniently located near major highways and freeways, including Interstate 5 and Highway 76, providing easy access to surrounding areas. Learn more on our Oceanside city guide.
What types of properties are available in Oceanside?
Oceanside, California offers a variety of single-family home types, including ranch-style, contemporary, and modern homes, each with their own unique architectural features and designs. These homes can be found throughout the city, from the coastal neighborhoods to the inland areas, providing a range of options for homebuyers. Most properties in Oceanside, California offer multiple bedrooms and were built in various years, ensuring a diverse selection for potential buyers. To explore different property types for sale in Oceanside, California, use the 'Home type' filter located above the active listings. Customize your search by selecting options like single-family homes, condos, townhomes, and more.
What is life like in Oceanside?
Living in Oceanside, California offers a unique experience with its stunning coastal landscape. The city is blessed with a mild Mediterranean climate, characterized by warm summers and cool winters. Job opportunities in Oceanside are diverse and range from industries such as tourism and hospitality to manufacturing and healthcare. The city provides a vibrant social scene with an array of recreational activities including surfing, hiking, and exploring the local parks. Residents can also enjoy a variety of dining options, shopping centers, and cultural events throughout the year.
What are the schools and amenities like in Oceanside?
Oceanside, California offers a variety of public amenities to its residents. Yes, there are numerous restaurants offering diverse culinary experiences. The city also boasts several parks for leisure and recreation. Grocery stores are plentiful, ensuring easy access to daily necessities. Additional amenities include libraries, fitness centers, and public transportation services, making Oceanside a convenient place to live.
In the past month, 137 homes have been sold in Oceanside. In addition to houses in Oceanside, there were also 89 condos, 42 townhouses, and 9 multi-family units for sale in Oceanside last month. Oceanside is a minimally walkable city in San Diego County with a Walk Score of 39. Oceanside is home to approximately 166,405 people and 37,387 jobs. Find your dream home in Oceanside using the tools above. Use filters to narrow your search by price, square feet, beds, and baths to find homes that fit your criteria. Our top-rated real estate agents in Oceanside are local experts and are ready to answer your questions about properties, neighborhoods, schools, and the newest listings for sale in Oceanside. Our Oceanside real estate stats and trends will give you more information about home buying and selling trends in Oceanside. If you're looking to sell your home in the Oceanside area, our listing agents can help you get the best price. Redfin is redefining real estate and the home buying process in Oceanside with industry-leading technology, full-service agents, and lower fees that provide a better value for Redfin buyers and sellers.


 REDFIN IS COMMITTED TO AND ABIDES BY THE FAIR HOUSING ACT AND EQUAL OPPORTUNITY ACT. READ REDFIN'S FAIR HOUSING POLICY AND THE NEW YORK STATE FAIR HOUSING NOTICE.
 United States
 Canada