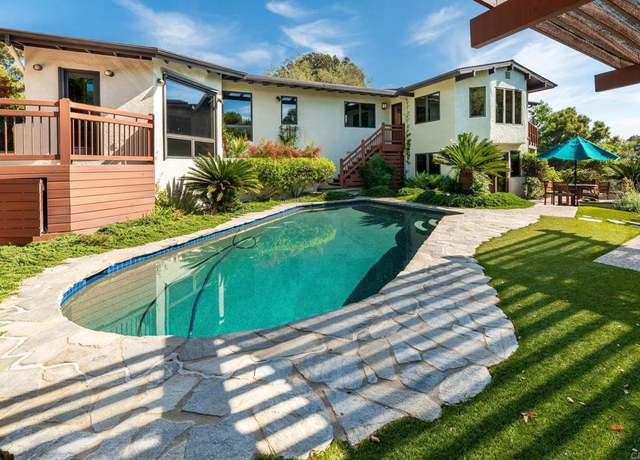
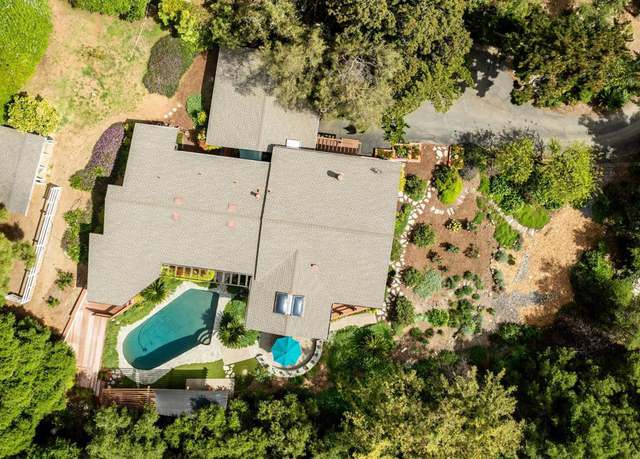
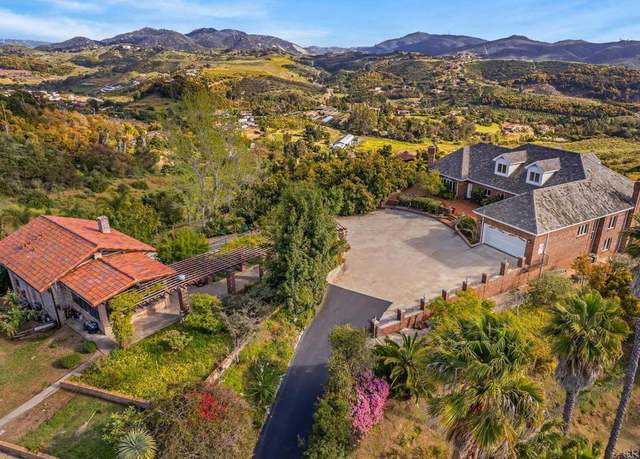
Secluded on a quiet, private lane with a gated entrance, this uniquely beautiful mid century, custom, split level home sits on . 63 of an acre. This tranquil oasis is in a lush park-like garden setting surrounded by mature oaks and adjacent to a dedicated Audubon preserve. This home has many architectural details throughout that add to its charm. The upper level of the home boasts a spacious, bright and airy French country kitchen with skylights and walls of windows that increase the open feeling and bring in natural light galore. There is an abundance of cabinetry, bamboo flooring, SS appliances and a breakfast area which has its own balcony and overlooks the pool. Enjoy the sweeping views
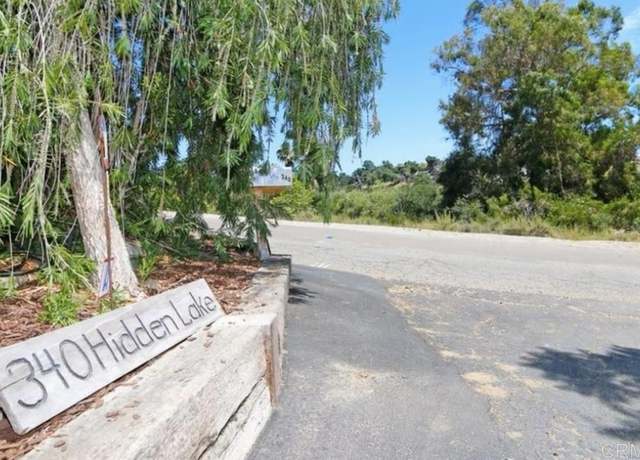
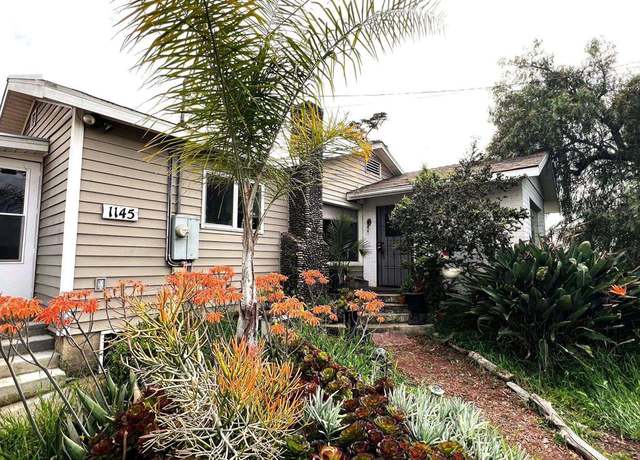
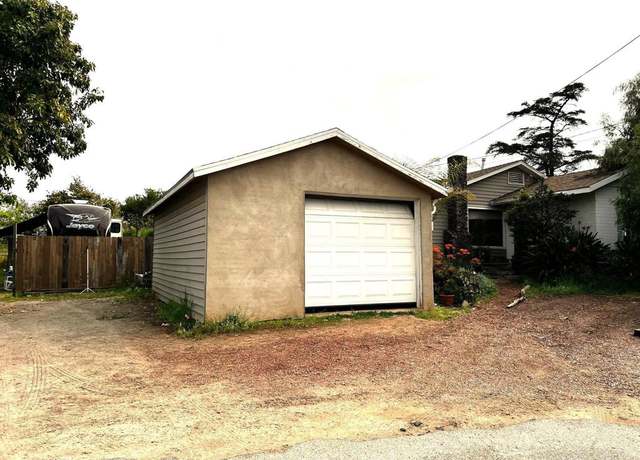
On offer is a tremendous value add property with unlimited potential. This home sits on one acre, perched atop a hill in the heart of Vista. The majority of the lot is flat and useable space, excellent for expansion, an accessory dwelling unit, or even another home if desired. As you enter the home, you are welcomed into a nice open space, which is the main living room and dining area. The bedrooms and kitchen connect to this central space, providing a focal point for the home. The main living area has nice hardwood flooring. In addition to the three bedrooms and two bathrooms in the main house structure, there is an additional, unpermitted bedroom and bathroom constructed behind the garage
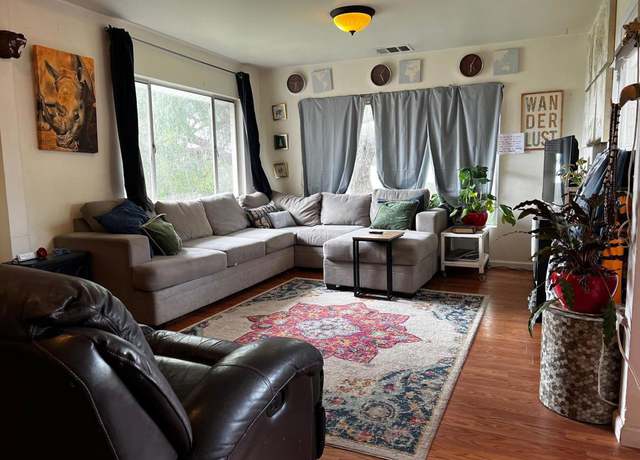
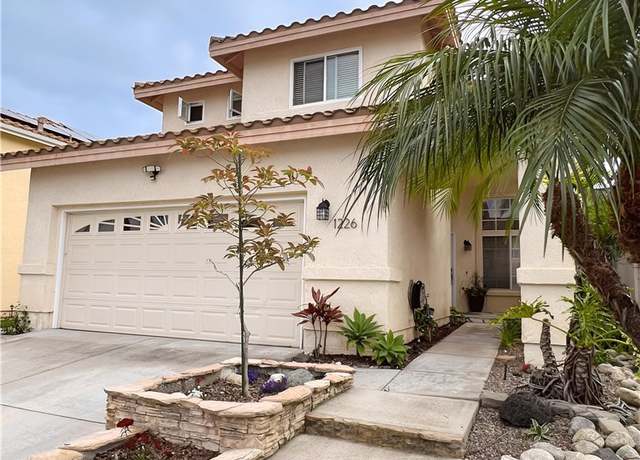
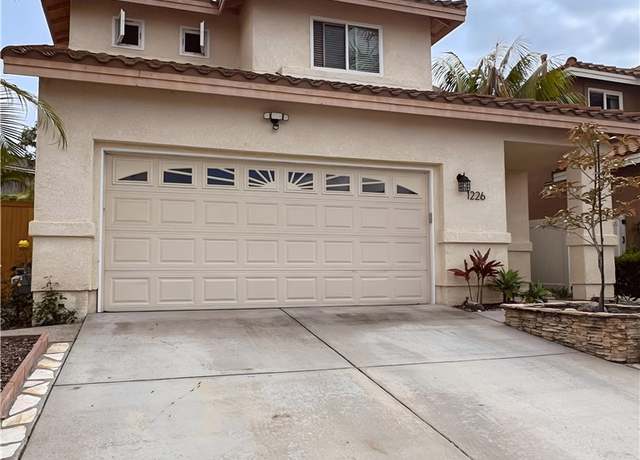
Welcome home! This turn-key, two-story, single-family home boasts 3 bedrooms, 2.5 bathrooms, and a bright, open floor plan. Upon entering, you are welcomed by abundant natural light, a cozy fireplace, and high ceilings. Your living, dining, and kitchen areas downstairs are seamlessly connected making it easy to entertain, relax and enjoy day-to-day living. Cook with ease in the spacious, updated kitchen offering stainless steel appliances, wood cabinets, and granite countertops. Ample counter space and an eat-in breakfast bar make it easy to prepare, serve and enjoy meals. Additionally, indoor laundry, a half bath and easy access to the two-car garage can be found on the home’s first
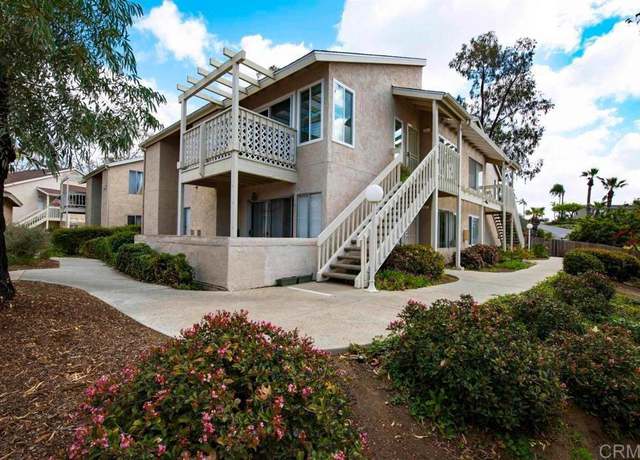
Live at The Park! Enjoy a radiant upper-level end unit that offers modern comfort and stunning views. This updated 3 bedroom, 2 full bath condo features newer dual-pane windows and patio door, LED lighting, updated kitchen counters, and updated bathrooms. The water heater was installed in 2021 and HOA replaced the roof in 2021 as well. You'll appreciate the recent upgrades, including the 2021-installed water heater and newer roof installed by HOA. Convenience is key with a single-car garage and an additional parking spot within easy reach. Indulge in the array of resort-like HOA amenities, including a sparkling community pool, inviting spa, clubhouse, well-equipped gym, and tennis courts. P
Welcome to 618 Cabezon Place, a stunning 4-bedroom, 3.5-bathroom home nestled on a nearly 1/4 acre premium view lot in the highly sought-after neighborhood of Alta Vista. This charming home boasts breathtaking mountain, city, & peekaboo ocean views, offering a serene and picturesque setting. As you step inside, you'll be greeted by a beautifully remodeled interior featuring 2,600 square feet of living space. The main level showcases a stunning living room with tall vaulted ceilings, a spacious family room, dining room, and a brand new custom kitchen with shaker cabinets, quartz countertops and new appliances. The first-floor bedroom with full bath is perfect for guests or a mother-in-l
Spacious one-story home with three bedrooms and two bathrooms. Large floor plan with 1827 square feet. Bright with natural lighting. Brand new kitchen with new stainless steel appliances included. Both bathrooms are newly remodeled. House has new paint, carpeting, cabinets, quartz countertops, recessed lights and fans throughout. New landscaping. Conveniently located close to freeway 78, schools, shopping center.
Enjoy your amazing view of the lake and golf course plus all the amazing wildlife everyday from your patio in the beautiful Shadowridge Aspens community. Extremely well maintained complex surrounded by the mature landscaping and the Shadowridge Golf Course. This condo has a great open floor plan with the best location and view with plenty of storage space, indoor stacked laundry, brand new HVAC, new water heater, newer roof, new flooring and your own 1 car garage. Shadowridge Aspens offers a community pool, spa and clubhouse making it a wonderful place to come home to, relax and take in a sunset. VA Approved complex.
View home with one of the largest lots in the neighborhood now available. Home has a fantastic view both from the backyard and the primary bedroom large balcony. The layout is spacious and has an abundance of light, with towering living room ceilings, perfect for entertaining or reading a book. Upgrades include fireplace, viewing deck, freshly painted exterior and interior, newer forced air unit and windows. Perfectly located at the end of a cal-de-sac and just feet away from the neighborhood park.
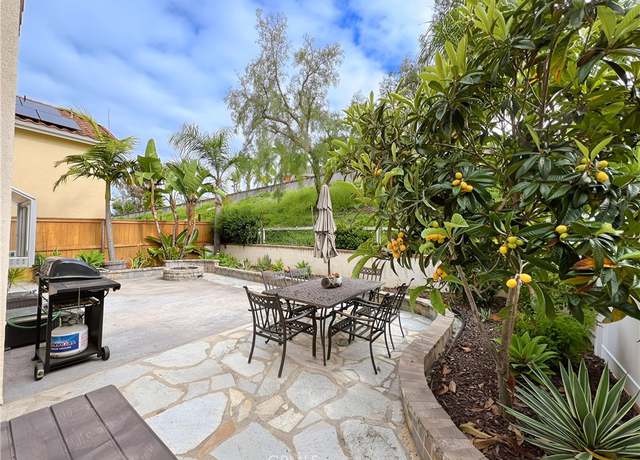
Spacious single story home in the rolling foothills of Vista. Step through the elegant stone archway into this magnificent retreat. High ceilings, large rooms & a chef's gourmet kitchen will be the backdrop for your magical gatherings. Start your quiet mornings in the enclosed patio right off the primary suite. Look out in wonder at the lavish backyard, filled with lush citrus, tropical, & exotic fruit trees (see supplement) & serene walkways. Paid off solar has 20 panels, a 6.5kw system. Though quiet & private, home is minutes away from restaurants & shopping. FRUIT TREES: apple, navel orange, valencia orange, 3 tangerine, 2 lemon, lime, fig, pomegranate, 2 gua
Stunning new 2024 custom-built home with NO HOA fees and NO Mello Roos! On a picturesque 14,000+ sq ft lot, this home includes a separate fully permitted ADU and still has plenty of outdoor space to play or even add another ADU. ADU even has separate water, gas, and electrical meters! The main house opens with a large entryway and an elegant great room that beautifully integrates living and dining areas with a sleek, modern kitchen. This open-concept space is designed for seamless indoor-outdoor living, courtesy of large sliding doors that bring in ample natural light and open to serene easterly views. The kitchen is a chef’s delight, equipped with new appliances, waterfall quartz co
Truly a one a kind opportunity to own an exquisite family home in Shadowridge with an attached ADU allowing for multi-generational living or a great income producing opportunity. The inviting main home has three bedrooms, 3 baths and an optional bedroom downstairs. The 1500SF ADU is ADA compliant with 2 bedrooms and 2.5 bathrooms. Both homes showcase exquisite materials such as slate and exotic wood flooring, designer tile and custom built ins in every room including the bedrooms. When you step inside you are greeted with soaring ceilings and wonderful natural light. The large gourmet kitchen boasts a built in bar and flows into the family room whose highlight is a floor to ceiling slate fi
Step into this inviting 3-bedroom, 2.5-bathroom condo tucked away in a gated community bordering Carlsbad, Vista, and San Marcos. As you explore, you'll be greeted by upscale touches at every turn, from the 5” baseboards to the 9-foot ceilings and recessed lighting, crafting an ambiance of warmth and luxury. The centerpiece of this residence is its gourmet kitchen, boasting a 36” continuous grate gas range, an expansive farmhouse sink, and ceiling-high white cabinets, offering both functionality and a modern aesthetic. On the lower level, brand-new luxury vinyl plank flooring adds durability and contemporary flair. Inside, find generously sized bedrooms, including a primary suit
Escape to the serenity of rural bliss with this charming 3-bedroom, 2-bathroom single-story home nestled in a peaceful neighborhood. Situated on a sprawling 1-acre lot, this property offers endless possibilities for relaxation, recreation, and personalization. Welcoming living space designed for comfort and convenience, offering ample room for family gatherings and cozy evenings by the fireplace. Step outside to your own slice of paradise, where the possibilities are endless. Whether you envision a lush garden, a tranquil oasis, or space for outdoor activities, this expansive acreage offers room to roam and explore. Plus the potential of the detached structure, formerly a 5-bay auto shop wi
Everybody's Dream: House-Hacking Opportunities, Investor and Multi-Gen Living! Get ready to unlock the door to endless possibilities! Stay tuned for the grand unveiling of this remarkable property—a rare opportunity you won't want to miss, beckoning you to make a purchase that just makes sense.
Welcome to 2032 Freedom Way in Vista. This renovated home features 3 bedrooms, 2 bathrooms, and 1543 square feet of living space in a quiet gated community. All bedrooms are conveniently located on the same level upstairs, while the main level offers an open and airy layout. The large back patio is perfect for entertaining guests or simply relaxing outdoors. Additionally, this home comes with owned solar panels, providing both environmental sustainability and potential cost savings. The gated community offers peace and security, while Vista itself boasts a charming downtown area with shops, restaurants, and entertainment options. Convenient access to the 78 freeway makes exploring nearby be
Welcome to the coveted community of Sea Vista. This meticulously crafted home offers a spacious layout bathed in abundant natural light, creating an inviting ambiance throughout. Step into the well-appointed kitchen, where the backyard Ocean Views beckon, providing a picturesque backdrop that extends towards the coastline. Designed for low-maintenance living, this home comes with Owned Solar. Ascending the stairs, you'll discover all bedrooms thoughtfully situated on the upper level. The primary bedroom treats you to breathtaking ocean views. Venture outside to the meticulously landscaped backyard, a haven of relaxation boasting mature greenery and ocean views. Enjoy being close to schools,
Nestled in the heart of Vista, this exquisitely renovated Cliff May builder masterpiece awaits. Meet mid-century architecture, enhanced with modern luxury. Boasting a spacious 3-bedroom, 2-bath layout with leased solar, this ranch-style sanctuary is ideal for California living. As you step inside, the open-concept design radiates with natural light, complementing the sleek quartz countertops that adorn the chef-inspired kitchen. Every corner of this home speaks of sophistication, harmoniously blending original mid-century charm with contemporary flair. This move-in ready and extremely functional home is equipped with central air conditioning, ensuring your utmost comfort in every season. Th
Stylishly updated, turnkey 3 BR 2.5 BA home in Ocean Hills! This property is situated in a nicely landscaped community of single family homes walking distance from Rancho Buena Vista High School! Upgrades include hardwood floors throughout, modern bathroom tile and vanities, stainless steel kitchen appliances and farm sink. The spacious and private backyard with market lighting is large enough to add a pool. The two-car garage is has plenty of room for your vehicles, tools and outdoor gear. This gem won’t last long - priced at less than $1M it is an incredible value in a great family-friendly community.
Brand new roof, New water heater and New wall furnace! Totally upgraded open floorplan home ready for move-in! Pull up to a beautiful fully landscaped front yard, a plenty of parking spaces on the front. The entrance welcomes you to formal living room. The kitchen has brand new cabinets, countertops. New dishwasher, stove and range hood. New vanity, faucet and toilet. New floors. Fresh paint inside and outside. Back family room is perfect for family and friends entertainment. This beautiful home shows pride of ownership and is truly turnkey. Close to schools, restaurants and shopping center. Must See!
Welcome to 1139 Sage Lane, a charming single-family home nestled within the serene gated community of Sierra in Vista, California, San Diego County. As you step inside, you're greeted by a warm and inviting living space featuring a cozy fireplace, perfect for gatherings with loved ones. The main floor boasts an open floor plan from Kitchen to living and dining area. Upstairs, you'll find all four bedrooms and three full baths. The master suite provides a spacious bathroom with dual sinks and a generous walk-in closet. Another bedroom across the hall also enjoys the convenience of its own bathroom. Loft upstairs offers a playroom for little ones or a productive home office space. Step outsid
Sizzle the senses - and be carried away with WOWS when you visit this sensational, newly-clothed 4 bd/3.5ba, 2167 sf two-story showstopper featuring over $300k of upgrades set beautifully in aromatic and lush gardens, a reminder of the original Eden! Sellers have left no stone unturned! Every room in the home has been modernized with economical and healthy living lifestyle as a focus, creating a peaceful, serene affordable paradise! The first floor features a formal living room, a 1/2 bath and a granite-clad, gourmet-cooks-envy kitchen adjacent to a spacious dining area with EZ french door access to an outdoor patio. BUT there's more: a bedroom, with a kitchenette and its own bathroom and p
Great investment opportunity, remodel or development project on a great lot with room for expansion and or an ADU. Conveniently located in Vista, this home provides easy access to a variety of nearby amenities, including shopping, dining, and entertainment options. House was recently a rental but in need of a major remodel, financing might not be an option.
STUNNING VIEW HOME IN SOUGHT-AFTER MONCADO SPRINGS WITH A NEW GOURMET KITCHEN AND STYLISH UPGRADES THROUGHOUT. THE KITCHEN IS NOT ONLY A SHOWPIECE BUT A PERFECT PLACE TO GATHER WITH FAMILY AND FRIENDS. THE HIGH-QUALITY J & K CABINETRY OFFERS PULLOUTS, SOFT CLOSE, A SPICE RACK, POTS & PANS DRAWERS, CORNER LAZY SUSAN AND DISPLAY CABINETS TO ADD INTEREST. UNDERCOUNTER AND FLAT CAN LIGHTING, RICH CUSTOM QUARTZ COUNTERTOPS, ISLAND SEATING, SS APPLIANCES, AND A FARMHOUSE SINK COMPLETE THIS KITCHEN THAT IS PERFECT FOR INDOOR/OUTDOOR ENTERTAINING. THE YARD IS PERFECTLY APPOINTED WITH LOUNGING AND GRASSY AREAS, MINI ROSES AND A PRODUCING BLUEBERRY BUSH AND BACKS TO THE TREE-LINED PRIVATE W
BRAND NEW CONSTRUCTION. Plan 3 Vignette – Beautiful, unfurnished Model home for sale that includes designer selected Countertops, backsplashes, upgraded Kitchen Cabinets, designer selected flooring. Solar is included. Ready for Move-in, early September 2024.
A dream 1521 Sq. Ft, 3-bedroom home ideal for comfortable living and luxury. Located in a Highly sought-after established neighborhood, Close to restaurants, grocery stores, shopping, 7.5 miles from beaches with Easy access to Carlsbad Village, Vista Village, and downtown Oceanside. A Remodeled single-story home (no stairs!), Spacious 0.26 acres lot with room for a pool or ADU (Accessory Dwelling Unit). Gorgeous backyard views Open floor plan with lots of natural light. Recently remodeled kitchen with new counters and recessed lighting as well as Updated bathrooms. Fireplace in the living room, Newer AC unit, Brand New Roof (2023) and an Attached two-car garage with Additional Driveway park
BRAND NEW CONSTRUCTION. Plan 3 Model Home – Beautiful Model home for sale, that includes designer selected Countertops, backsplashes, upgraded Kitchen Cabinets and flooring & window coverings through out! Solar included, completely Turnkey home that includes Refrigerator, Washer & Dryer, and ready for Move-in, Early September 2024
BRAND NEW CONSTRUCTION. 3 story townhouse located in OCEANSIDE. Plan 1 Model Home - Beautiful Model home for sale, with 1st floor Flex Room for office or hobby room, in addition to designer selected Countertops, backsplashes, Upgraded Kitchen Cabinets and flooring & window coverings through out! Solar included, completely Turnkey home that includes Refrigerator, Washer & Dryer, and ready for Move-in, Early September 2024.
* * Exceptional Living in Vista Cascade – A Premier 55+ Community * * Discover the perfect blend of space, style, and affordability in this 1,344 square foot home located in the highly sought-after Vista Cascade community. This land-owned 55+ community eliminates the hassle of space rent with a remarkably low HOA fee of just $384 per month, which conveniently includes water, trash, basic cable, and access to extensive amenities. Freshly painted inside and out, the home has a welcoming open floor plan that is ideal for entertaining. It features three large bedrooms, including a Primary suite with a private bath, ensuring ample space and privacy. Positioned in a prime location withi
Wow, the extras with this home!! Not only gorgeous and well maintained, this home has PAID OFF SOLAR, a self-monitoring security system and Smart Home features, an open floor plan, 4 bedrooms AND a loft plus 3 1/2 baths! The kitchen is outfitted with sleek metal pull-outs & automatic faucet, center island and wifi connected syncing GE profile appliances ($5k). The white cabinets have been finished with crown moulding. You'll love cooking with this double convection oven with air-fryer, an oversized stainless microwave, stainless dishwasher & refrigerator. There's lots of shelving in the pantry and extra deep storage in the entry closet as well. The kitchen opens to the dining
Come view this wonderful 3 bedroom, 2 and a half bath home located minutes from the 78. Well cared for and maintained by one owner since 1998. The lower level features a Living Room, Dining , Kitchen, Laundry Room, Storage Room, attached 2 car direct access Garage and a nice rear yard to enjoy the SO Cal sunshine. The upper level features a spacious Master Suite and two additional Bedrooms and a full hall bathroom.
Welcome to your dream home nestled in a prime Vista location, offering the allure of Hollywood Hills charm with city and mountain views. This custom-built masterpiece spans 3,200 square feet on a sprawling 1/3 acre lot, providing ample space for outdoor living and entertaining. Step inside to discover a newly renovated throughout interior boasting 5 bedrooms and 3 bathrooms, adorned with original wood floors meticulously refinished to enhance the home's timeless appeal. The abundant natural light floods the interiors through endless windows, creating a warm and inviting ambiance throughout. The main level features a spacious open concept living area, perfect for hosting gatherings or unwind
Charlemont is one of Vista's most popular communities. This 1104 sq. ft. model townhome is rarely on sale and offers: modern kitchen w/ granite counters, in-house laundry, living/dining room, gas fireplace, 2 bedrooms EACH w/ en-suite baths/closets, attic w/ storage, private sunny patio w/ direct access to large 2 car garage. A/C, new water heater. HOA fees include 2 community pools/BBQ areas/water/trash. Park-like comm. grounds. Pets ok. Easy access to highly rated local schools, shopping, restaurants, highway access. 7 Miles to beaches.
Experience the Epitome of Luxury Living in This Exquisite 3,883 Sq Ft Residence Nestled on a sprawling . 59-acre lot, this magnificent home is a true oasis of comfort and elegance. Boasting 5 spacious bedrooms and 4 modern bathrooms, this property is designed to cater to the most discerning tastes. Step into a world of sophistication as you enter the grand living room, where a stunning fireplace adds a touch of warmth and luxury. The formal dining area, with its chic ambiance, is perfect for hosting memorable dinners. The family room, complete with a stylish bar, is an ideal space for relaxing and entertaining guests. The heart of this home is the gourmet kitchen, equipped with state-of-the
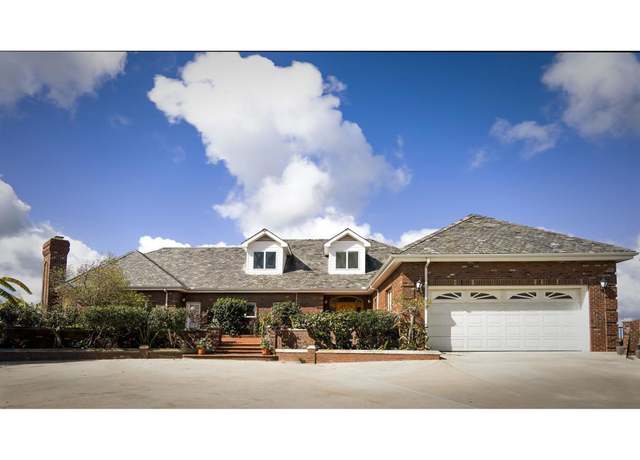
Southern Plantation style, one-acre estate located on the most sought-after street in Vista. Step inside, and you'll be greeted by the elegance of marble flooring and a grand foyer graced by a stunning chandelier, setting the tone for the grandeur that awaits you throughout the home. The estate boasts 5 bedrooms and 5 bathrooms, with one bedroom located downstairs. The master suite is a true sanctuary, featuring a cozy fireplace, a spacious room with balcony access, and breathtaking views. The estate also includes an office space with a fireplace and a bonus game room. Additionally, an upstairs loft provides a versatile space that can be used as an additional living area. With two staircase
Welcome to this cozy 1-bedroom, 2nd story condominium offering a blend of simplicity and comfort. Enjoy the bright open floor plan with a living room dinning room combo and vaulted ceilings. Updates include new AC & ducting as of January 2024, windows, slider, carpet, bathroom remodel, drop down ladder to spacious attic & garage door. Step out onto the balcony for a breath of fresh air and enjoy the neighborhood views. Warm up by the fireplace during a rainy day and read your favorite book. Convenience is key with in-unit washer-dryer hookups, eliminating the hassle of laundromat visits. Your vehicle will have its own secure spot in the 1-car garage, featuring an update door. As
Welcome to this perfectly crafted retreat! This enchanting home features 3 bedrooms, 2 baths, and an impressive 1,789 square feet of carefully designed living space. Nestled on a tranquil cul-de-sac, this property exudes a sense of peace and harmony, offering a sanctuary deck that overlooks a citrus grove. Step inside to discover newly remodeled bathrooms, a sleek modern kitchen, and cozy bedrooms designed for relaxation. The bonus room with a private entrance provides flexibility and convenience for your unique needs. Enjoy natural light filtering through double-pane windows and a skylight, while recessed lights and fans add a touch of elegance in every corner. Don't miss the opportunity t
3 Bedroom 2 Full Bath + family room Manufactured Home in very desirable ALL-AGE Community! This beautiful home features: A large kitchen with appliances included with plenty kitchen cabinets and a breakfast bar. Primary bedroom has en suite bathroom with garden tub, dual pane windows on most of the home, laundry room with washer and dryer included, attached covered carport, storage shed, spacious porch and much more to list! Home is located close to all beautiful San Diego has to offer and grocery stores, schools, banks, parks, shopping, freeways… The community is well maintained, pet friendly & amenities include: A clubhouse, common area maintenance, swimming pool, hot tub&hel
Welcome to the epitome of suburban charm at 1248 Alta Vista Dr, nestled in the coveted Orleavo Heights neighborhood of Vista. This single-story gem sits on one of the most sought-after streets, offering a serene retreat with a perfect blend of convenience and privacy. Boasting a spacious layout, this home features 3 bedrooms and 3 full baths, ensuring ample space for comfortable living. The charming ambiance is complemented by a picturesque setting, with beautiful views of the rolling hills and cityscape. On clear days, catch glimpses of the ocean in the distance, adding a touch of coastal magic to the landscape. A highlight of this residence is its seamless indoor-outdoor flow, inviting yo
This delightful 4 bedroom, 3 bathroom split level home offers a perfect blend of comfort, convenience, and California living. As you step inside, you'll be greeted by an inviting living space, a brick fireplace with built-in shelving and original hardwood floors. The home is filled with natural light streaming through bright windows and French doors leading to the large patio deck. The inviting floor plan is unique, downstairs is a complete one bedroom unit with kitchenette, and private entrance, great for additional income or multi generational living or possible Airbnb. The spacious master bedroom is complete with an en-suite bathroom and closet space. Two additional bedrooms offer versat
This area's enrollment policy is not based solely on geography. Please check the school district website for more information.
Elementary schools
Middle schools
High schools
GreatSchools Summary Rating
9/10
Casita Center For Science/math/technology
Public, K-5
6/10
Hannalei Elementary School
Public, K-5
6/10
Lake Elementary School
Public, K-5
6/10
T.H.E Leadership Academy
Public, K-5
5/10
Bobier Elementary School
Public, K-5
Only showing 5 of
18 elementary schools.
School data is provided by GreatSchools, a nonprofit organization. Redfin recommends buyers and renters use GreatSchools information and ratings as a first step, and conduct their own investigation to determine their desired schools or school districts, including by contacting and visiting the schools themselves.Redfin does not endorse or guarantee this information. School service boundaries are intended to be used as a reference only; they may change and are not guaranteed to be accurate. To verify school enrollment eligibility, contact the school district directly.
Homes for sale in Vista have a median listing price of $815K. Some of these homes are Hot Homes, meaning they're likely to sell quickly.
What are some of the most popular neighborhoods in Vista?
Popular neighborhoods include College Area, Guajome, Calavera Hills, Twin Oaks Valley, Leisure Village Oceanside, Peacock, Ocean Hills, Ivey Ranch-Rancho del Oro, Rancho Carlsbad, and Mira Costa.
How often does Redfin update their new listings?
Most of our new listings in Vista are updated every 5 minutes so you can see new homes as soon as they come on the market. Learn more
What is transportation like in Vista?
Vista, California offers a variety of transportation options, including a well-developed public transportation system. The city is served by the North County Transit District, which provides bus and rail services, offering residents alternatives to car travel. For those who prefer to drive, Vista experiences moderate traffic levels, especially during peak hours. Additionally, the city's strategic location provides easy access to major highways and freeways, including the nearby Interstate 5 and Highway 78. Learn more on our Vista city guide.
What types of properties are available in Vista?
Vista, California offers a variety of single-family home types, including ranch-style, contemporary, and modern homes, among others, each with their own unique architectural features and designs; these homes can be found throughout the city, including in neighborhoods such as Shadowridge, Buena Creek, and Vista Village, among others, providing a range of options for homebuyers looking for their ideal property; most properties in Vista, California offer multiple bedrooms and were built in various years, ensuring a diverse selection of homes to choose from; To explore different property types for sale in Vista, California, use the 'Home type' filter located above the active listings. Customize your search by selecting options like single-family homes, condos, townhomes, and more.
What is life like in Vista?
Vista, California offers a serene and picturesque environment with its rolling hills and stunning views. The region experiences a mild Mediterranean climate, characterized by warm summers and cool winters. The area provides a range of job opportunities across various industries, including technology, healthcare, and manufacturing. Residents can indulge in a plethora of recreational activities such as hiking, biking, and exploring the numerous parks and trails. The city also boasts a vibrant arts and culture scene, with local galleries, theaters, and community events to enjoy.
What are the schools and amenities like in Vista?
Vista, California, offers a variety of public amenities to its residents. You'll find a plethora of restaurants, catering to a wide range of culinary tastes. The city is also home to numerous parks, providing ample space for leisure and recreation. Grocery stores are readily available, ensuring convenient access to daily necessities. Additional amenities include public libraries, fitness centers, and a vibrant arts scene with a local theater.
In the past month, 61 homes have been sold in Vista. In addition to houses in Vista, there were also 31 condos, 8 townhouses, and 6 multi-family units for sale in Vista last month. Vista is a minimally walkable city in San Diego County with a Walk Score of 46. Vista is home to approximately 93,486 people and 32,506 jobs. Find your dream home in Vista using the tools above. Use filters to narrow your search by price, square feet, beds, and baths to find homes that fit your criteria. Our top-rated real estate agents in Vista are local experts and are ready to answer your questions about properties, neighborhoods, schools, and the newest listings for sale in Vista. Our Vista real estate stats and trends will give you more information about home buying and selling trends in Vista. If you're looking to sell your home in the Vista area, our listing agents can help you get the best price. Redfin is redefining real estate and the home buying process in Vista with industry-leading technology, full-service agents, and lower fees that provide a better value for Redfin buyers and sellers.


 REDFIN IS COMMITTED TO AND ABIDES BY THE FAIR HOUSING ACT AND EQUAL OPPORTUNITY ACT. READ REDFIN'S FAIR HOUSING POLICY AND THE NEW YORK STATE FAIR HOUSING NOTICE.
 United States
 Canada