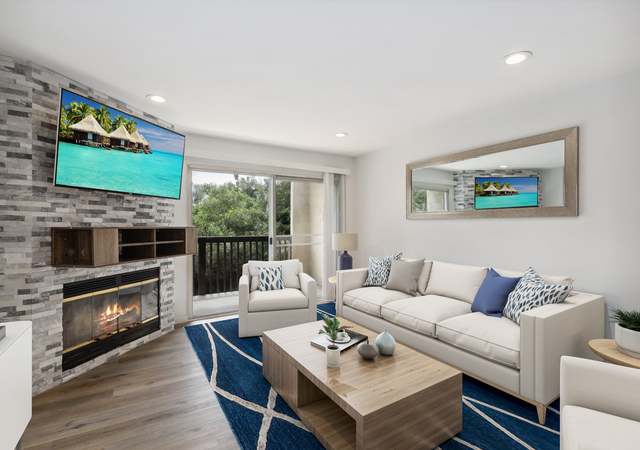
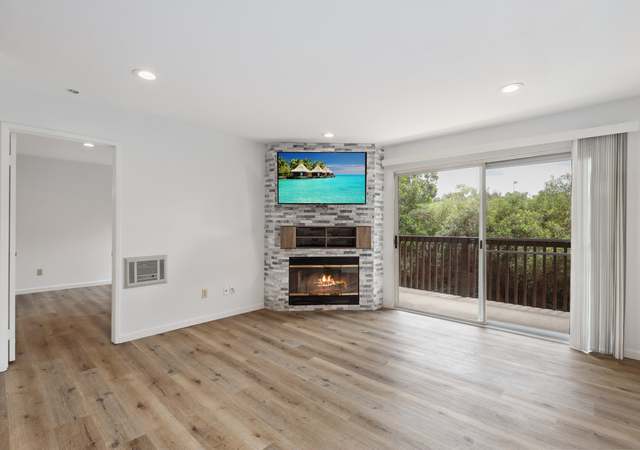
TOTALLY REMODELED, LUXURY CONDO in the gated resort community of La Costa Hills- Welcome to your stunning 2 Bedroom home! This spacious, GROUND LEVEL CONDO showcases a cozy front patio and security door screen for privacy or enjoying a cool breeze. Stepping inside you are greeted by luxury vinyl plank floors throughout, lots of natural light, and a nice view of the lovely green trees outside. The Living room features a custom stone fireplace with the TV mount that is already installed and a little entertainment niche. The Kitchen has white cabinets with a quartz counter and custom tile backsplash which is complimented by stainless appliances. There is even a pantry to maximize your storage
Welcome to your dream home in Carlsbad's highly coveted Foothills community! Located on a quiet cul-de-sac location, this stunning home has been meticulously maintained and high quality design details are reflected throughout including NEW: Interior and exterior paint, Shaw engineered hardwood flooring, carpet in the upstairs bedrooms, Satori porcelain tile in the bathrooms and laundry room. The expansive gourmet kitchen boasts NEW custom frameless Deep Blue Sea solid wood cabinetry, 8 slabs of Caesarstone white quartz countertops with a waterfall island, pendant lighting, high end stainless steel appliances including a Chef’s stove, Bosch refrigerator, microwave drawer and beverage r
Single story end unit townhome in the Las Playas community of Carlsbad. This elevated location adds privacy and some ocean views. Large wrap around patio that's perfect for morning coffee and enjoying the evening sunsets. Very open and bright layout with vaulted ceilings and large family room with a fireplace. Featuring 2 bedrooms and 2 full baths along with a full-size closet laundry and new windows. Great community amenities including tennis courts, pool, spa, clubhouse and playground. Walking distance to award winning Pacific Rim elementary school. Close to Carlsbad state beach, Batiquitos Lagoon, shopping, restaurants and the fwy. This is the perfect place to call home!
Nestled on an expansive . 36AC corner & private lot within the sought-after enclave of Bressi Ranch. This magnificent 3,480 square foot "single level" home epitomizes luxurious living. Boasting an unparalleled resort-like ambiance, the meticulously landscaped backyard is a sanctuary of serenity, featuring a captivating saltwater pool as its centerpiece. Step inside and be greeted by an exquisite floor plan designed for both comfort and sophistication. With 4 generously-sized bedrooms plus a versatile den/office, every corner of this residence exudes functionality. A stunning interior courtyard, adorned with a custom fountain, adds an enchanting touch to the home's ambiance.
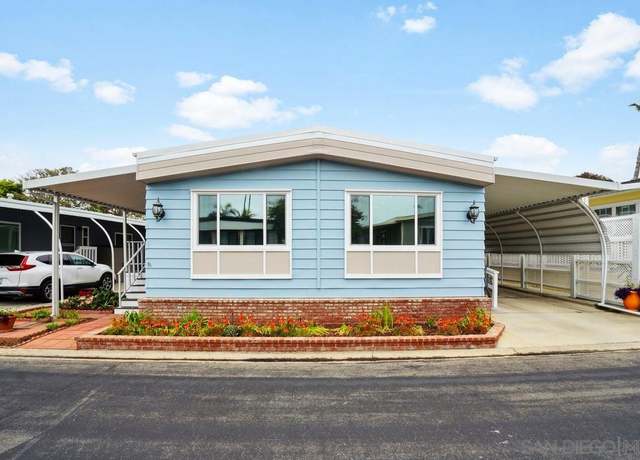
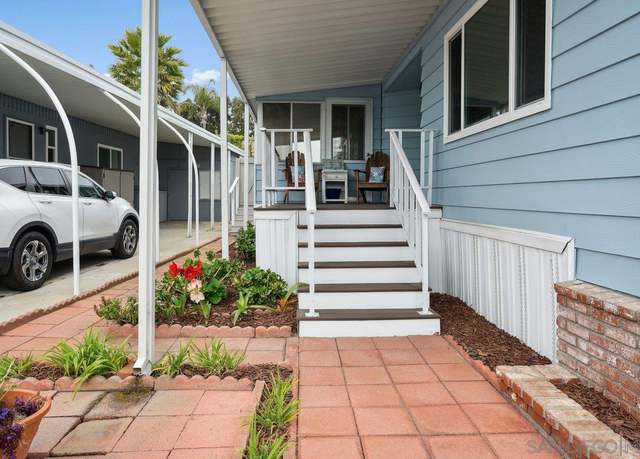
This beautiful 2 bedroom, 2 bath plus bonus room home has been remodeled front to back!!! Walking distance to the beach & shopping and located in Lakeshore Gardens, one of the most desirable 55+ beach communities in So. Cal. The best of beach life, in a home and community you can be proud to live and entertain in!!! The open floor plan features a new central kitchen with new cabinets, quartz countertops, lots of counter space and all the best in appliances!!! New vinyl windows, luxury vinyl planking throughout and more!!! Both bathrooms have also been updated. At this price you can afford to make your dream of living at the beach a reality!!! This beautiful 2 bedroom, 2 bath plus bo
Nestled in Carlsbad's coveted Aviara neighborhood of Tramonto, this corner-lot home boasts a bright and open floor plan with wood flooring, an oversized primary bedroom with dual closets, ensuite bath with separate tub and shower. The yard is spacious with a mix of turf and patio and a built-in BBQ. The garage features epoxy floors, built-in cabinets, and overhead storage. New solar panels paired with a Tesla battery. Community pool, spa and BBQ. Close to well known Batiquitos Lagoon and wildlife preserve with miles of walking trails, as well as award-winning Carlsbad schools, luxury resorts, dining, shopping, and beaches.
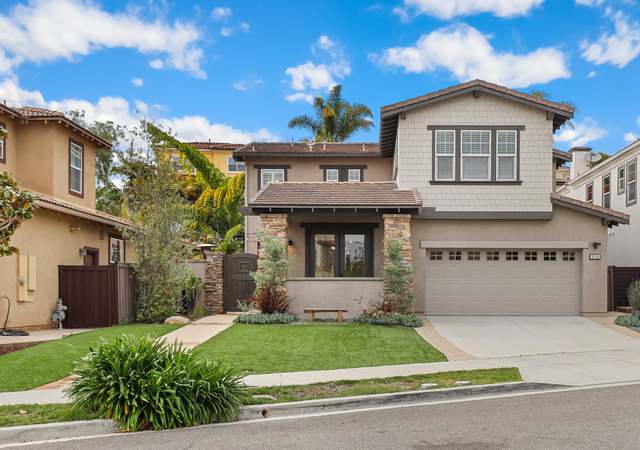
Live by the beach in one of Carlsbad’s most sought-after neighborhoods. This rarely available Santander corner lot home in San Pacifico is West of the 5 freeway and a short walk to the beach! Featuring 4-bedrooms + upstairs guest room with a separate entrance, spacious floorplan with a bedroom/bath downstairs, quartz countertops, LVP flooring, vaulted ceilings, recessed lighting, spacious primary bedroom with private deck, low maintenance yard and 2 garages with ample parking! The San Pacifico community offers a community pool with lap lanes, spa, 2 tennis courts, volleyball court, BBQ, picnic tables, walking trails that stretch along the Batiquitos lagoon. This is resort style living
LOCATION, LOCATION, LOCATION, for the first time in almost a quarter century this wonderfully located 2-bedroom, 2 bathroom PLUS loft townhome is on the market. This property recently received all new sliding glass doors, new forced air-unit, remodeled main suite shower and it's ready for a new owner. The home offers a wonderful floor plan with a large kitchen with room for a table, spacious family room with cozy fireplace, nice deck off the back and a large two-car garage. Enjoy community amenities including pool, spa, tennis court, picnic areas, walking trails and beautiful Hosp Grove. Super convenient location, less than a mile to the freeway and 1.5 miles to the beach. Enjoy the Farmers
This large home boasts large living room with vaulted ceiling and gas fireplace. Two Primary bedroom suites - each with full bathroom and den/sitting room. Home has solar panels, tankless water heater, water filter for kitchen sink, instant hot water in Primary bathroom, newer A/C unit and Circuit Breaker Box with ample room for expansion, Ring doorbell. The interior of the home needs some updating but this home could really be a WOW home. You must see this home and community. Located 3 houses down from the Clubhouse and other community amenities. If you are over 55 years of age - come check out this private Resort Style community of 504 detached homes on over 100 Acres of LAND THAT YOU OWN
Welcome to this fantastic home located in the desirable Brookfield neighborhood of La Costa, South Carlsbad. Boasting numerous updates throughout, this lovely residence offers a blend of elegance and comfort. Upon entering, you're greeted by the inviting living room, featuring elegant high ceilings that create a spacious and airy ambiance, complemented by an abundance of natural light. The family room, transformed into a large dining area, is enhanced by a gas start fireplace, perfect for cozy gatherings. Adjacent to the dining area is the gourmet kitchen, complete with granite countertops, a travertine backsplash, custom cabinetry with ample storage, GE Monogram appliances including a refr
Downtown Carlsbad, Corner lot with Ocean Views. Property has detached studio and 1 full bath included in square footage. Main home has 2 bedrooms, 1 bath. Detached 2 car garage. Property sold as is. Buyer to verify ALL MLS information, room dimensions, permits, and square footage, Etc, before the close of escrow. information contained herein is deemed reliable but not guaranteed.
Embrace the essence of coastal living in this exquisitely updated single-story home perfectly positioned on a cul-de-sac with ocean views, solar (owned), and a sprawling backyard. From the moment you enter, the distressed bamboo flooring offers a warm welcome and extends throughout the home. The spacious living room, illuminated by natural light, showcases a stunning gas fireplace with glass, floor-to-ceiling tiling and an elevated hearth. The living room is further complemented by custom shelving and built-in cabinetry, and an elegant custom-designed bar, complete with a beverage/wine fridge. The kitchen boasts custom cabinetry, stainless steel appliances, gorgeous quartzite counters, an e
Rarely available single story La Costa Valley retreat poised on a wonderful cul-de-sac. Pristinely maintained, this home sets the new standard for quality living. 2,716 square feet of living space with a spacious primary suite, 2 additional bedrooms for accommodating guests with ease & an office, this open concept floor plan offers every room privacy & comfort. The kitchen serves as the heart of the home allowing for seamless interaction between all living spaces with a sizable island, 6 burner gas stove, dual ovens, pendant lighting & an exceptional amount of storage space. The kitchen seamlessly flows into the large family room creating an inviting space for memorable ga
This is a beautiful 3 bedroom, two and a half bath dream home nestled next to a gorgeous Carlsbad lagoon, a well-known water sports destination! Never worry about parking, simply walk out of your private, gated Laguna Shores community and enjoy stand up paddle boarding, jet skiing, boating or fishing to your heart’s delight. Your forever home is ideally located on a cul-de-sac in this exclusive community with a backyard oasis boasting beautiful flowers and plants for wonderful indoor outdoor living. Your chef’s kitchen includes high-end appliances, beautiful cabinetry, counters and backsplash next to a charming dining room and living room with fireplace. There is a spacious prim
Beautiful Aqua Hedionda Lagoon views! Welcome to the gated Windsong Cove enclave of Olde Carlsbad! Located west of I-5 & just steps away from Aqua Hedionda Lagoon, this first-floor, end-unit with two primary suites, and a versatile 1st floor bonus room or optional 3rd BR offers the ultimate seaside lifestyle. Private cul-de-sac street location. Designed for effortless living, the luminous main level seamlessly blends convenience and comfort with an abundance of natural light & generous windows working to create a spacious high-end feel with a backdrop of lagoon views! Beyond the functional entryway w/ gorgeous hardwood floors, the home flows into an open-concept layout connectin
Top Floor, End Unit! This 1-bedroom / 2-full bath condo is located on the grounds of the beautiful Omni La Costa Resort. The condo is zoned as and is an active short-term rental. The kitchen boasts stainless steel appliances that include a counter depth refrigerator, an electric stove/oven, a microwave and a dishwasher. The spacious bedroom looks out on lush, green landscaping and bright, colorful birds of paradise and fits a king-size bed. Pocket doors have been added to separate the living area from the bedroom for added privacy. Two oversized sliders create a wall of windows that allow lots of light, sunshine and light breezes into the space. The condo comes equipped with washer and drye
This is a townhome that feels like a house! Set in the wonderful Bay Shores community in Oceanside, this home includes a 2-car garage and a private yard that leads into the kitchen. There are 2 spacious bedrooms with a full bathroom upstairs and a half bathroom downstairs. Both bathrooms have been upgraded with fresh paint, new light fixtures, and vanities. The bedrooms, living room, stairs and hallway have new carpet and the downstairs floor has beautiful wood-like tile for a modern look. The home conveniently has laundry hookups in the kitchen.
Welcome home to this beautiful VIEW-property in the highly-coveted Mira Costa Mesa neighborhood on the border of Oceanside & Carlsbad. Feeding into the CARLSBAD SCHOOL DISTRICT, this extensively remodeled home underwent a huge 2007 renovation with over $250,000 in upgrades and designer finishes. Every detail exemplifies a commitment to luxury living. The perfectly landscaped front beckons you in as the custom designer exterior paint further demonstrates the first of many elevated design experiences. Step inside to a great room flooded with natural light, vaulted ceilings and views straight past your stunning resort-style backyard. Living like a true single-story, the main level showca
Stunning 5bed + office with Panoramic Views! Welcome to your sanctuary perched in a serene cul-de-sac location, offering unrivaled vistas. This meticulously maintained residence boasts breathtaking sunsets, a generous layout (bed/bath downstairs), and an enchanting backyard oasis. Valley Club amenities, olympic sized pool, tennis, hot tub, parks. Escape to your private haven, complete with lush fruit trees and ample space for outdoor gatherings and relaxation. This home exudes pride of ownership, generously appointed living spaces provide ample room for relaxation and productivity, including a convenient bed and bath downstairs. Spectacular Views: Marvel at sweeping views stretching across
Introducing an extraordinary opportunity nestled in the vibrant heart of Carlsbad, California. This expansive and luminous end-unit condo epitomizes coastal living with its seamless indoor-outdoor flow, amplified by towering windows and two inviting balconies, blending the comforts of home with the allure of the outdoors. The home features two master suites, each equipped with its own bathroom, ensuring privacy and convenience for residents and guests alike. Boasting three well-appointed bathrooms, dedicated parking, and access to communal amenities such as a pool, this residence echoes unparalleled convenience at every turn. Its prime location offers convenient access to the best of Carlsb
Welcome to your inviting and airy coastal retreat nestled in the heart of Olde Carlsbad! This charming home bathes in natural light, creating a serene atmosphere throughout. Boasting two tiered yards, including a spacious backyard, it's perfect for enjoying the quintessential California lifestyle. Recent upgrades ensure peace of mind and comfort for years to come. A brand-new Owens Corning Duration Shingle Roof installed in May 2021 offers durability and style, while a new furnace and ducting installed in March 2022 guarantee cozy warmth during cooler months. Beat the summer heat with newly installed ceiling fans in July 2022, and enjoy endless hot showers with the new hot water heater adde
Discover your dream home in the coveted Alga Hills neighborhood of Carlsbad! The primary bedroom boasts a balcony overlooking a serene canyon, providing a tranquil retreat. Enjoy the community pool and spacious living areas, ideal for relaxation and entertainment. Step outside to the fenced backyard, a private oasis for outdoor gatherings and playtime. Benefit from energy-efficient solar panels and indulge your culinary passions in the high-end kitchen with a large island. Park with ease in the attached 3-car garage. Located in a prime location with nearby amenities, parks, and acclaimed schools, this home offers luxury living at its finest. Don't miss out—schedule your viewing today!
Bright Open Floor Plan, Single-Story home! Carlsbad School district! Calavera Hills area. Large well cared for back yard with playscape, solar heated above ground pool with adjoining deck with a peek ocean view. Watch the sunset from the deck. Spacious kitchen with granite counters, big island, double ovens and gas cooktop. Primary bedroom boasts a huge 9x9 walk in closet. Hardwood and tile flooring through out. New 2020 central air conditioning and furnace. New roof in 2019. Mature fruit trees. Separate laundry room. Wood burning fireplace. Plenty of storage inside and out. RV parking with 220 hook up also for electric car charging. Built-in cabinets in garage. Easy freeway access and mi
Experience the warmth of home in this exquisite 5-bedroom, 3-bathroom estate situated in the exclusive La Costa Valley, one of the most sought-after coastal communities in San Diego County. Upon entering this private enclave, you'll be greeted by the inviting ambiance of the neighborhood. The open layout, complemented by tall ceilings, sets the stage for a delightful living experience. The well-designed floor plan includes a spacious kitchen seamlessly connected to the family room, a downstairs bedroom and full bath, and sliding doors leading to the expansive backyard. The versatility of the 5th bedroom allows for various uses, such as a guest room, children's playroom, teen lounge, or dua
Old charm meets modern living in sought out Olde Carlsbad. This home offers modern amenities with relaxed coastal lifestyle. Nestled in a quaint cul-de-sac close to all. This beautiful updated 5-bedroom 3.5 Bath home is boasting in charm and character with newly renovated kitchen and bathrooms. The front and back yards are an entertainers dream with pool and privacy. Upon entry you are welcomed with a private gated patio and pergola, covered seating and porch. When entering your choice of dining room or living area into an easy flowing renovated kitchen with breakfast nook and open living area. The possibilities are endless here. The spacious property boasts a plethora of desirable features
Nestled in the Alga Hills above the prestigious Omni La Coast Golf course and very near the soothing blue waters of the nearby Carlsbad Beaches this home in a beautiful planned community is a perfect family home on a private Cul-de-Sac. It offers a serene escape from the hustle and bustle of eveyday life and yet is increadibly close to great shoping, restaurants and movie threatres. This well designed home with a spacious floor plan is the perfect sanctuary to unwind and entertain. Residents can enjoy leisurely strolls along manicured pathways, tee off at the nearby golf course or relax on a sandy beach just minutes away. Whether you are seaking an active lifestyle or a tranquil retreat thi
Beautifully updated SINGLE STORY home on a HUGE POOL SIZED LOT in desirable Rancho Carrillo! Situated on over 1/3 of an acre, this stunning property features a spacious floorplan and beautiful views. Upon entering, you'll find fresh paint, luxurious vinyl flooring, soaring ceilings, recessed lighting, and more. The living room and separate dining room (currently utilized as a playroom) are located off the entryway. A separate family room features a cozy gas fireplace, ceiling fan, and plantation shutters. Open concept kitchen has freshly painted cabinets, ample storage, double oven, island with space for seating, and breakfast area. Primary retreat features sliding doors to backyard, walk-i
Beach Bliss Awaits! Move-In-Ready Dream Home in Prime Carlsbad Location! This stunning, just-now remodeled ocean view home is your gateway to the perfect California beach lifestyle. Move right in and enjoy breathtaking sunsets from the comfort of your sofa! Location, Location, Location! This gem boasts an unbeatable location: Less than 1 mile to the gorgeous Carlsbad beach for sun, sand, and surf therapy. A leisurely 3-minute stroll to a top-rated California elementary school – perfect for families! A few blocks walk to the scenic Poinsettia Park, ideal for picnics, playtime and sports. Explore the world-famous Flower Fields, Legoland, Costco, and a vibrant shopping center –
Contemporary masterpiece in Sanderling at Aviara. Completely redesigned with exacting detail. Luxury vinyl flooring & new baseboards. Custom kitchen redesign: quartz countertops, Samsung smart appliances, timeless herringbone backsplash, modern lighting improvements, custom shades and shutters. Primary bathroom features walk in shower with quartz seat. Custom master bedroom walk-in closet. Guest bath features soaking tub. Newly installed solar with Tesla battery (NEM 2.0) EV Level 2 plug-in wall charger, Nest smoke and carbon monoxide detectors, Drip watering system in patio garden. Mounted outdoor television. Additional built-in storage in garage, newer water heater, quiet electric g
This is the epitome of the adage location, location, location. The gorgeous Plan 2 home in Viridian at La Costa Greens offers spectacular views of the La Costa Golf Course and beyond. Situated on a knoll backed up to open space, this home’s amenities include a spacious kitchen with a large granite island open to the family room, formal living room, morning room/home office, bonus/media room with built-in speakers, outdoor covered veranda with fireplace, dining room with built-in hutch, and paid for solar with a Tesla Powerwall with EV charging. Residents of La Costa Greens have the exclusive use of “The Presidio” and its resort-like amenities, including a community pool, t
Welcome to Olde Carlsbad! Nestled in a garden setting, this elegant single-story residence exudes warmth and casual sophistication. The updated kitchen is perfect for creating your favorite meals. The bathrooms have also been recently updated and the private backyard creates an inviting space for entertaining guests. A dedicated office provides the perfect environment for working from home and a cozy guest room-library with a Murphy bed offers flexibility for hosting visitors. Located close to the beach and Carlsbad Village, this home offers the quintessential coastal lifestyle. With its prime location, this residence provides easy access to local amenities without compromising on tranquili
Views Views Views! PANORAMIC OCEAN VIEWS from the Patio! PANORAMIC CANYON VIEWS Overlooking Carlsbad from your Private Backyard! MOUNTAIN VIEWS to the East! Location Location Location! Quiet End Unit with only One Connected Wall with an Open Floor Plan, Side Windows for Extra Natural Light! Vaulted Ceilings in both the Extra Large Primary & Guest Bedrooms each with En Suite Bathrooms! End of cul-de-sac location with no through traffic and Extra Guest Parking! Two Blocks to Calavera Park with "Concerts in the Park" on Summer Evenings! Always Coveted Carlsbad School District! Community Gardening area across the street! Private Access Swimming Pool one block away! Make arrangem
Rarely on the market and hard to find value towards the end of a spacious 1 street sided cul-a-sac in the gated community of Montevino in Rancho Carrillo, Carlsbad. Featuring five ensuite bedrooms, one half bath downstairs, family and living rooms, plus a formal dining room with soaring ceilings. Uniquely includes a private separate entranced ADU upstairs that has its own laundry, kitchen, and living area (great for investment value or for multigenerational families). Enjoy stunning sunsets & bbq's from the beautifully landscaped backyard or from the spacious balcony in the master bedroom. The comfortable open concept family room along with the kitchen are connected with a breakfast n
Welcome to the coveted community of Sea Vista. This meticulously crafted home offers a spacious layout bathed in abundant natural light, creating an inviting ambiance throughout. Step into the well-appointed kitchen, where the backyard Ocean Views beckon, providing a picturesque backdrop that extends towards the coastline. Designed for low-maintenance living, this home comes with Owned Solar. Ascending the stairs, you'll discover all bedrooms thoughtfully situated on the upper level. The primary bedroom treats you to breathtaking ocean views. Venture outside to the meticulously landscaped backyard, a haven of relaxation boasting mature greenery and ocean views. Enjoy being close to schools,
Rare 3 bedroom townhome over 2100 sf on the OMNI La Costa Resort's Legend Golf Course * * This Bridgeview unit is perched above the 15th teebox & offers gorgeous views out to the 14th green * * Fairway VIEWS from the Living room, Dining room, Kitchen, BONUS Office & Large Balcony * * Floorplan Specs: GROUND LEVEL = Family Room + 2 Guest Bedrooms + Full Bath + Full Laundry with plenty of storage + BONUS Niche #1 (gym, playroom, yoga) * * 2nd LEVEL= Living + Dining + Spacious Primary Ensuite with private balcony + Guest 1/2 bath + BONUS Niche #2 (office) * * Spacious & Sunny Balcony with sweeping golf course views (gas bib for BBQ) * * 2 CAR attached garage
Introducing a stunning residence nestled within the sought-after community of Treviso Carlsbad! This exceptional home was constructed in 2022, and in January 2023 the owners upgraded the solar system to 5.9kW N. E. M. 2.0 (no electric bills)! The home is a spacious 2,048 sqft, 3 bedrooms with an optional 4th bedroom on the second floor, and two and a half baths. Meticulously upgraded, the property features 9-foot ceilings, upgraded luxury hard flooring and carpet, additional LED recessed lighting, upgraded quartz countertops in the kitchen and linen storage area, a sleek 12’ sliding glass wall in the kitchen/dining area to a patio and custom outdoor
Here It Is! Single level 3 Bedroom, 2 Bath, Turn-Key home in the sought after Carlsbad Village neighborhood. This stunning home recently underwent a complete renovation, with a open concept layout allows for easy entertaining and seamless indoor/outdoor living. The kitchen is a chef's delight with high-end appliances, custom cabinetry, and porcelain countertops. The master suite is a tranquil oasis with a spa-like en-suite bathroom and walk-in closet. The back yard is a private paradise with a built-in BBQ area, cozy fireplace, pergola for shade, and lush landscaping including lemon trees. The front yard is perfect for gathering around the fire-pit on cool evenings or enjoying the expansive
This is your chance to not only fulfill your dream of owning a beach home, but exceeding your expectations!!! This fabulous home is not only three blocks to the beach, but it's also located on one of the most sought after lakefront lots in beautiful Lakeshore Gardens, one of the most desirable 55+ beach communities in Southern California!!! Plus it is one block to Poinsettia Village shopping center, which has a Ralphs, Rite Aid, restaurants, financial institutions and more!!! Your friends and family won't believe that you live on a lake and can walk to the beach!!! Isn't it time to start living your dream!!! This is your chance to not only fulfill your dream of owning a beach home, but
Come take a look at this spacious family home in the stunning coastal community of La Costa Valley. Offering 5 bedrooms plus an office and additional retreat (flexible space for a home gym, nursery, or study), this Greystone II Collection home has a huge 9300 square foot lot ready for a pool, ADU, or just serene space to unwind with plenty of greenery. The enormous eat-in kitchen has endless counter space as well as an island with second sink and peninsula overlooking the family room with custom built-in media center. This home accommodates a large family and out of town visitors with a downstairs bedroom and brand new full bath, while two zone a/c is ready for those rare days without cool
This area's enrollment policy is not based solely on geography. Please check the school district website for more information.
Elementary schools
Middle schools
High schools
GreatSchools Summary Rating
10/10
Magnolia Elementary School
Public, K-5
9/10
El Camino Creek Elementary School
Public, K-6
9/10
Olivenhain Pioneer Elementary School
Public, K-6
9/10
Aviara Oaks Elementary School
Public, K-5
9/10
Poinsettia Elementary School
Public, K-5
Only showing 5 of
21 elementary schools.
School data is provided by GreatSchools, a nonprofit organization. Redfin recommends buyers and renters use GreatSchools information and ratings as a first step, and conduct their own investigation to determine their desired schools or school districts, including by contacting and visiting the schools themselves.Redfin does not endorse or guarantee this information. School service boundaries are intended to be used as a reference only; they may change and are not guaranteed to be accurate. To verify school enrollment eligibility, contact the school district directly.
Homes for sale in Carlsbad have a median listing price of $1.65M. Some of these homes are Hot Homes, meaning they're likely to sell quickly.
What are some of the most popular neighborhoods in Carlsbad?
Popular neighborhoods include Leucadia, Aviara, Carlsbad Village, Olivenhain, Calavera Hills, Ocean Hills, Bressi Ranch, Olde Carlsbad, La Costa, and Mira Costa.
Carlsbad, California offers a variety of transportation options for its residents, including a robust public transportation system. The city is well-served by buses and trains, providing easy access to local and regional destinations. For those who prefer to drive, Carlsbad is conveniently located near several major highways and freeways, including Interstate 5 and Highway 78. However, it's worth noting that traffic levels can be high during peak commuting hours, so plan your car journeys accordingly. Learn more on our Carlsbad city guide.
What types of properties are available in Carlsbad?
Carlsbad, California offers a range of single-family home types, including ranch-style, contemporary, and modern designs, each with their own unique features and architectural styles. These homes can be found throughout the city, from the coastal neighborhoods near the beach to the inland communities. Most properties in Carlsbad, California have three to five bedrooms and were built in various years, providing a diverse selection for homebuyers. To explore different property types for sale in Carlsbad, California, use the 'Home type' filter located above the active listings. Customize your search by selecting options like single-family homes, condos, townhomes, and more.
What is life like in Carlsbad?
Carlsbad, California offers a serene coastal living experience with breathtaking views of the Pacific Ocean. The city boasts a diverse range of landscapes, including picturesque beaches, rolling hills, and lush green parks. The weather is consistently pleasant, with mild winters and warm summers, creating an idyllic environment for outdoor activities. The city provides ample job opportunities across various industries, including technology, healthcare, and manufacturing. Residents can enjoy a vibrant lifestyle with access to a wide array of recreational activities, such as hiking, surfing, golfing, and exploring the local art and music scene.
What are the schools and amenities like in Carlsbad?
Carlsbad, California is a city rich in public amenities, catering to the diverse needs of its residents. The city boasts a variety of restaurants, offering a wide range of cuisines to satisfy all food lovers. Numerous parks dot the city landscape, providing ample green spaces for relaxation and recreation. Grocery stores are conveniently located throughout the city, ensuring easy access to daily essentials. Additional amenities in Carlsbad include fitness centers, libraries, and shopping centers, all contributing to a comfortable and convenient lifestyle.
In the past month, 98 homes have been sold in Carlsbad. In addition to houses in Carlsbad, there were also 48 condos, 44 townhouses, and 5 multi-family units for sale in Carlsbad last month. Carlsbad is a minimally walkable city in San Diego County with a Walk Score of 31. Carlsbad is home to approximately 105,537 people and 61,198 jobs. Find your dream home in Carlsbad using the tools above. Use filters to narrow your search by price, square feet, beds, and baths to find homes that fit your criteria. Our top-rated real estate agents in Carlsbad are local experts and are ready to answer your questions about properties, neighborhoods, schools, and the newest listings for sale in Carlsbad. Our Carlsbad real estate stats and trends will give you more information about home buying and selling trends in Carlsbad. If you're looking to sell your home in the Carlsbad area, our listing agents can help you get the best price. Redfin is redefining real estate and the home buying process in Carlsbad with industry-leading technology, full-service agents, and lower fees that provide a better value for Redfin buyers and sellers.


 REDFIN IS COMMITTED TO AND ABIDES BY THE FAIR HOUSING ACT AND EQUAL OPPORTUNITY ACT. READ REDFIN'S FAIR HOUSING POLICY AND THE NEW YORK STATE FAIR HOUSING NOTICE.
 United States
 Canada