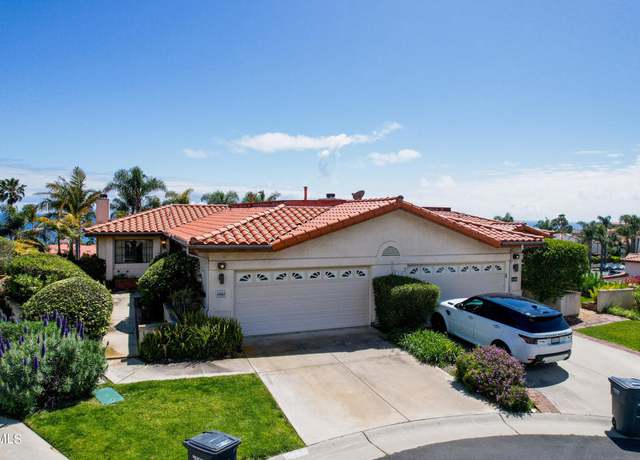
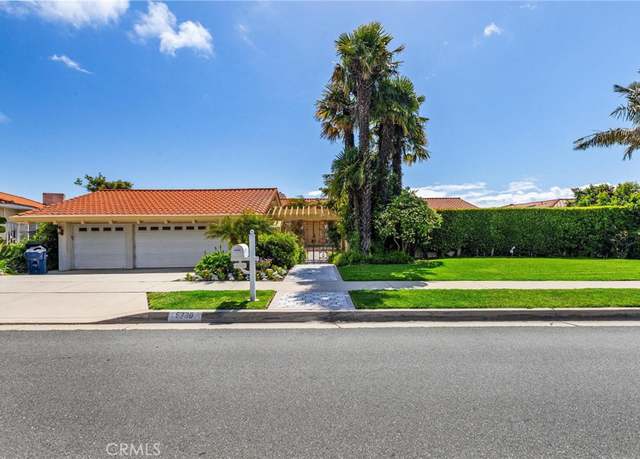
Start climbing that hill! Delightful single family, one-level home located on a quiet cul-de-sac in the Eastview neighborhood of Rancho Palos Verdes. Original owner and never on the market before, this three bedroom, two bath home is a wonderful starter with opportunities to add your personal finishing touches! It is well kept and move in ready. An inviting entrance opens to the living area to the left with formal dining room attached. To the right, natural hardwood flooring will guide you to the bedrooms and bathrooms. This home features an extra large primary bedroom with en suite bath. Sliding glass doors from either the living room, or primary bedroom, lead t
Sea Bluff Home with ocean view in highly coveted Rancho Palos Verdes. 3-bedroom, 3-bathroom residence with views of the ocean to Catalina Island from the elegant living room with bar. Natural light, high ceilings and generous windows frame the lush coastal living, while the fireplace adds a touch of warmth. Full kitchen, where the love for cooking is rekindled with ample cabinetry, large countertops, and a casual dining area for breakfast and lunch. Expansive balcony, a perfect setting for al fresco dining or simply enjoying the coastal vistas. The additional family room, featuring durable hardwood flooring and custom-built shelving, provides an adaptable space for entertainment or a quiet
Welcome to your dream oasis !!Stunning ocean, Catalina and Golf course views! Gated entrance with great curb appeal. Magnificent living room with beautiful hardwood flooring, two family rooms, 5 bedrooms plus library(can be the sixth bedroom or maids quarter). Tranquil Backyard to enjoy the fantastic ocean view! Excellent floorplan for family living and entertaining! Nestled in the serene coastal community, this exquisite house offers the perfect blend of luxury and comfort. As you step through the wrought iron gates into the enchanting courtyard, you're greeted by the sight of a sparkling private pool, surrounded by lush greenery, creating a tranquil haven for relaxation and entertainment.
Perched on a serene cul de sac in Rancho Palos Verdes, this elegant home offers a seamless blend of comfort and sophistication. Featuring a total of 3 bedrooms plus bonus room and 4 bathrooms across 2,288 square feet, this residence exudes timeless charm. The main level features 3 beds and 2.5 baths, a family room with fireplace, a large living room with breathtaking ocean views, and a recently refreshed kitchen. A private entrance leads to a versatile downstairs room, with a half bath, ideal as an office or 4th bedroom. The kitchen showcases new quartz countertops, freshly painted cabinets, recessed lighting, and new stainless steel sink. Abundant natural light illuminates the interior, ac
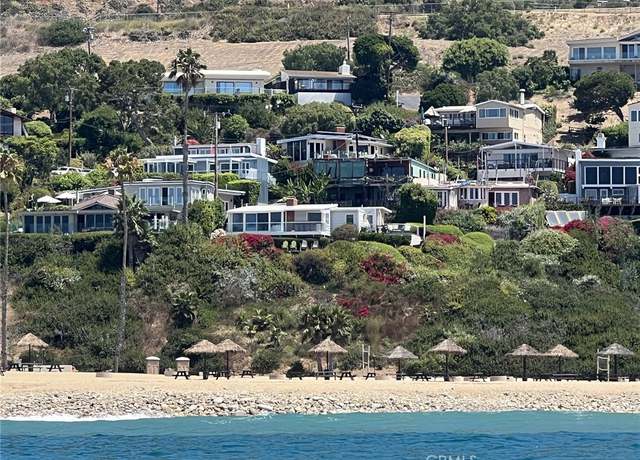
Location, location, location. Oceanfront beach house in Portuguese Bend Beach Club. There are 180 degree unblock-able Catalina and ocean views. Watch dolphins and surfers from your living room. Private beach. This property is truly spectacular!!! Plans to remodel have already been submitted to the city, and there is still time to customize the finishes. Portuguese Bend Beach Club is a private, gated community with amazing homeowner amenities. House is being sold as-is.
Nestle in the sought after Eastview neighborhood of Rancho Palos Verdes! Charming single story 4 bedroom 2 bath home with a gorgeous one of a kind private resort like backyard for all your family gatherings and entertainment, situated on a tranquil Cul-de-Sac neighborhood. Property features a great layout, spacious master bedroom and bathroom, 3 additional bedrooms, 1 bathrooms, cozy fireplace, living room and dining combo for a large family. Tile/laminate floors throughout the main areas of the home and nicely well kept kitchen that looks over and leads to the tropical pool area. The Backyard features beautifully landscaped, pebble floor, custom fireplace and patio area, custom pool with w
$1,299,800
4 beds2 baths1,624 sq ft7,459 sq ft (lot)
28621 Mount Whitney Way, Rancho Palos Verdes, CA 90275
OCEANFRONT, TOP FLOOR, CORNER PENTHOUSE. .. .. Welcome to Ocean Terrace . .. resort-style living at its finest! You’ll feel like you’re on vacation every day while enjoying the fabulous PANORAMIC UNOBSTRUCTED VIEWS of the ocean, Palos Verdes shoreline, Catalina Island, prestigious and lush national 18-hole golf course and the stunning sunsets. This elegantly remodeled 3-bedroom, 2-bath condo faces southwest which provides the greatest exposure to the golden California sunshine and views. Unit 301 is the corner unit in the oceanfront building with jaw-dropping vistas and streaming with natural light. The open floorplan lends itself perfectly to entertaining, with a spacious deck
$1,395,000
3 beds2 baths1,527 sq ft
3200 La Rotonda Dr #301, Rancho Palos Verdes, CA 90275
This kind of home rarely comes on the market, so don’t let it get away. A luxurious Rancho Palos Verdes gem just minutes away from the ocean and walking distance to numerous hiking trails. This chic Mediterranean style residence with 4 bedrooms and 3 baths has over 2500 sq ft of living space and is situated on a 32,000 sq ft lot. The home was expertly designed to marry the serenity of a life in the Palos Verdes Hills with the pride and luxury of resort-style living. Custom double entry door opens to rustic hardwood floors, fireplace and walls of glass that bring the outdoor elements right into your living space. This sense of mastery continues into the gourmet kitchen equipped with dr
Welcome to 27923 Golden Meadow Drive! This single story, panoramic ocean view home will take your breath away as you relax in the spacious backyard enjoying spectacular sunsets every evening. This desirable retreat has been newly remodeled, with laminate floors, smooth ceilings, recessed lights, new stainless appliances, fresh paint and ceiling fans. Other features include a living room fireplace, hot tub, enclosed private courtyard in front of house, lots of natural light, inside laundry room, built ins, 2 car attached garage and a friendly / peaceful neighborhood and award-winning Palos Verdes Unified Schools. Don't miss this rare gem!
$1,850,000
4 beds2 baths1,816 sq ft9,311 sq ft (lot)
27923 Golden Meadow Dr, Rancho Palos Verdes, CA 90275
Beautiful, bright and well laid out top floor end unit. This spacious and well thought out floor plan which puts the master suite which boasts a large walk in closet on one side and the other two bedrooms with bathroom on the opposite side, great for privacy. Large living and dining room with high vaulted ceilings, recessed lighting, fireplace and private balcony. Sliding glass door and plantation shutters leading to balcony. Central air conditioning and heating, washer dryer hookups in unit. Brand new AC/Heating. Newer wide plank laminate flooring and new Samsung Tuscan appliances. SMART HOME features - Schlage wifi and keyless front door lock, Nest Smart Thermostat, wifi/smart enabled rec
Welcome to your tranquil oasis in Miraleste Pines. This stunning California ranch home has undergone a major renovation, making it turnkey and and ready for its new owners to enjoy the luxurious modern upgrades. This 4 bedroom, 2 bathroom home has a spacious living room, complete with a stunning gas fireplace dazzled by a lovely tile surround. The kitchen has bright white cabinets with beautiful quartz countertops and a large island, perfect for a chef to create delicious meals. Picture yourself and your guests enjoying your meals in the lovely dining room off of the kitchen. The main living areas have recessed lighting that makes the home sparkle. The primary suite is a peaceful retreat th
An oceanfront custom-built contemporary home offered by the original owner. First time in 35 years! The house has a fantastic architectural design with an open floor plan and excellent rooflines, panoramic views of the ocean, Catalina Island, and extensive bluffs. There is a resort-like backyard with a pool, spa, and a huge flat grass area with beautiful mature landscaping. There are 4 bedrooms and a huge library, 5 baths, an impressive foyer with a double staircase, high ceilings, a formal living room, a great room, a primary bedroom with spacious walk-in closets, and a huge bath; gourmet kitchen with two center islands and a nook with magnificent views. The lower level has an entertaining
Welcome to Seahill Townhomes, where tranquility meets luxury in this resort-quality community. Nestled at the end of a serene cul-de-sac just blocks from the majestic bluffs of the Palos Verdes Peninsula and the renowned Terranea resort, this end unit townhome offers captivating ocean and Catalina Island views from multiple balconies and a bedroom. With nearly 2700 square feet of living space, including 3 bedrooms, 4 bathrooms, an entertainment room, craft room or wine cellar, generous rear yard, front courtyard, 2-car attached garage, and 2-car driveway, this home boasts a desirable floorplan that feels more like a single-family residence. The red tile roofs and ocean vistas evoke the char
Nestled atop the serene Miraleste Hills, this tranquil haven offers breathtaking views of the ocean, harbor, mountains and city, tucked away at the end of a peaceful cul-de-sac. Upon entry, a gracious formal living room awaits, complete with a cozy fireplace and expansive window framing the tranquil front garden with classic fountain. Entertain in style in the generous formal dining room, perfect for hosting cherished family gatherings. The sizable family room seamlessly connects to the eat-in kitchen, featuring a sliding door that opens to the inviting outdoor oasis, complete w/ a refreshing pool and ample space for alfresco dining. The pool is heated by family owned solar panels. There is
$1,995,000
4 beds2.5 baths2,600 sq ft0.33 acre (lot)
30061 Grandpoint Ln, Rancho Palos Verdes, CA 90275
AFFORDABLY PRICED RPV SINGLE FAMILY HOME WITH ACCESS TO PV SCHOOLS. THIS CHARMING ONE LEVEL EASTVIEW HOME IS IN A GREAT LOCATION CLOSE TO SHOPPING ON WESTERN AVENUE. IT HAS BEEN WELL CARED FOR AND UPGRADED WITH DUAL PANED WINDOWS, SLIDING FRENCH DOORS IN LIVING ROOM, CENTRAL A/C, REMODELED KITCHEN AND BATHROOMS. THE LARGE BACKYARD HAS A GREAT PATIO WITH A PERGOLA AND LAWN AREA. NEWER CARPETING, FRESHLY PAINTED INTERIOR, SECTIONAL GARAGE DOOR. THE OWNER IS IN THE PROCESS OF UPGRADING THE ELECTRICAL PANEL AND ALL OULTETS PRIOR TO THE CLOSE OF ESCROW.
Ocean View Gem rare on the market. This 4-bedroom, 3-bathroom home is located in the prestigious Pt. Vicente neighborhood of Rancho Palos Verdes and is offering a blend of spaciousness, character and ocean vistas. The first-floor opens up into a primary suite, provides a tranquil retreat with a view of the zen-like courtyard and features a remodeled bathroom with a stand up shower, exquisite tiling, dual shower heads and vanity area. The large living room, complete with a cozy brick fireplace and a full wall of windows, transitions through a wet bar area into the formal dining room and a versatile space suitable for a home office. The gourmet kitchen is equipped with lots of cabinetry, lar
Welcome home! Resort style living…a true “staycation” in Harbor Walk Community! This enchanting single level condo is perfect for everyone from first time home buyers to empty-nesters. This condo boasts oversized bedrooms and a large living room (with fireplace) that opens out to a lovely deck. Central Air, too! A gorgeous pool and jacuzzi tucked into the bucolic setting of mature trees and running brooks only makes this property more special. A gorgeous oasis tucked away quietly from all yet easy access to anything you need! Great proximity to shops, schools, parks and restaurants. 2 designated parking spots (not tandem), extra storage closet on site, guest parking and
Brand New Construction! The ONLY new construction available for sale on the Palos Verdes Peninsula. This brand new home was just completed and has been beautifully staged! High ceilings, gleaming floors and walls of glass to enjoy the amazing harbor views! The oversized 3-car garage leads directly to the entry level which opens to the impressive “great room”. The chef inspired kitchen features GE CAFE appliances and a center island. The adjacent dining area opens to the expansive living room with fireplace and multiple sliding doors leading to the covered balcony; perfect for enjoying the views. There’s also a 4th bedroom / office with expansive balcony, private bathroo
Welcome to 26361 Dunwood Road, found in the highly sought-after Rollingwood neighborhood! Step inside and be greeted by the inviting entry way and open floorplan, adorned with recessed lighting and vaulted ceilings that create a spacious and airy ambiance. Hardwood floors in the main living areas and gas fireplace add warmth and charm, while French doors invite abundant natural light and lead to the outdoor wood deck, perfect for al fresco dining and entertaining. The tastefully remodeled kitchen boasts granite countertops, double ovens, a kitchen island with cooktop, custom cabinetry and large pantry. The primary bedroom comes equipped with a gorgeous bay window and upgraded bathroom with
Check out link to website with drone video, floorplan and dollhouse views. Coast down the private drive to this sanctuary of serenity and leave your cares and the world behind you. Nestled in its own forest glade in the heart of the Palos Verdes Peninsula, this rare retreat is the ultimate haven from the hustle and bustle of Los Angeles metro yet it’s close to everything. This mainly one level escape takes full advantage of a serene lifestyle of indoor/outdoor living with extensive glass that overlooks your ¾+ acre (33,256 sq. ft. !) of lush lawn and woodland with an amazing sense of privacy and peace. With this much land, you can entertain graciously, have ample space for kids
Welcome to your coastal retreat! This meticulously updated property offers an unparalleled blend of comfort, style, and breathtaking ocean views. Step inside this spacious 4-bedroom, 3-bathroom haven, where modern updates and luxurious amenities await at every turn. The living space features wood and carpet flooring, creating a warm and inviting ambiance perfect for both relaxation and entertaining. The heart of the home is undoubtedly the gourmet kitchen, adorned with sleek marble countertops, a 6-burner stove, dishwasher, and ample storage space. Prepare culinary delights while taking in sweeping ocean vistas through the dual pane windows, creating a culinary experience unlike any other.
$2,995,000
4 beds3 baths2,720 sq ft0.41 acre (lot)
30804 Via La Cresta, Rancho Palos Verdes, CA 90275
Welcome home to the best unit in the building in highly sought after La Collina! This gorgeous one bedroom one bath condo on the top floor shows brand new with it's clean and bright interior, and chef-ready kitchen with stainless steel appliances. Bask in the advantages of being in the most desirable location; larger sqft, only one shared wall, high ceilings and no one above you, uninhibited natural sunlight, and the elevator services your floor only and is shared with just one neighbor next door. The spacious open floor plan allows for comfort and style, and the large balcony is ready for a glass of wine to enjoy those South Bay sunsets. Other features include stackable washer and dryer in
$789,888
1 bed1 bath920 sq ft
627 Deep Valley Dr Unit P501, Palos Verdes Peninsula, CA 90274
Welcome to your beautiful ocean view home in the highly sought-after Lunada Bay of Palos Verdes Estates! Located on a serene and quiet street, this exceptional home exudes elegance and charm from the moment you arrive. Upon entering, you will be greeted by an updated interior with cathedral ceilings that amplify the sense of grandeur and spaciousness. The home features wood flooring, updated bathrooms, and a remodeled kitchen. Recent upgrades, including newer paint, roof, plumbing & sewer lines ensure a worry-free and comfortable living environment. Cozy up by the fireplace in the inviting living room overlooking the open views outside, or unwind in the spacious family room, complete
WATCH VIDEO ON 360 TOUR LINK! Well thought out quality reconfiguration of this Los Verdes floorplan with Views of the Ocean from inside the home. Custom Kitchen with Thermador Appliance Package. Vast Storage in Kitchen with cabinetry on both sides of the Ship Lap Island w/ Quartz Counter Top, including pull out Sliding Shelves in the Island & Pantry. White Oak Engineered hardwood throughout home. Redesigned Primary Bath with Walk-in seamless shower. New "gray line" under the entire slab for water going out, replacing the old galvanized pipe. New Pex lines for entire home for water coming in. New Furnace & Ducting (furnace includes the A/C coil to make installing A/C e
MID CENTURY MODERN WITH GRAND COASTLINE VIEWS! Welcome to Rancho Palos Verdes, a luxury suburb at the southern tip of the South Bay in Los Angeles County. And step-in to luxury with this prestigious updated mid-century modern masterpiece. As you step inside, be greeted by the enchanting glow of transom windows, inviting abundant natural light to fill every corner of this serene retreat. Marvel at the panoramic southern views stretching across the majestic Saddleback Mountains, the bustling LA Harbor, and the vast expanse of the Pacific Ocean. The heart of the home awaits in the gourmet kitchen, boasting sleek stainless steel appliances that perfectly complement the timeless elegance of hard
Discover your dream coastal retreat in the private, gated community of Portuguese Bend Beach Club with this spectacular, modernized beach bungalow. This 3-bedroom, 3-bath home offers breathtaking ocean views from every angle and boasts a chic kitchen with Viking appliances, custom cabinetry, and a farmhouse sink. The Primary suite provides a peaceful haven with a walk-in closet and luxurious ensuite bathroom. The spacious living room is perfect for cozying up by the fireplace or enjoying timeless views of the Pacific. A large ocean view deck above the garage, complete with automated awnings, is ideal for entertaining. Property ownership includes exclusive beach access and a host of amenitie
MLS# EV24077787 REPRESENTATIVE PHOTOS ADDED. July Completion! REPRESENTATIVE PHOTOS ADDED. Experience California coastal living at its best with Harbor Pointe floor plans. Our open-concept layouts are perfect for family gatherings or hosting friends. Enjoy spacious kitchens with top-of-the-line appliances, luxurious owner's suites, and modern amenities throughout. Retreat to your oasis with dual vanities, walk-in closets, and soaking tubs for a spa-like experience at home. Situated within the gated, master-planned Ponte Vista community, enjoy a wealth of amenities including a pool, recreation center, exercise room, gas BBQs, parks, walking trails, and a fire pit. Your convenience is ensured
MLS#EV24077737 REPRESENTATIVE PHOTOS ADDED. Discover the pinnacle of California coastal living at Harbor Pointe! Our spacious floor plans are perfect for family gatherings or hosting guests, featuring open concept layouts for a cozy atmosphere. Enjoy oversized kitchen islands, luxurious owners' suites, and modern comforts throughout. The heart of your home revolves around our meticulously designed kitchens, equipped with top-notch amenities. Retreat to your serene owners' suite with dual vanities, and walk-in closets. Nestled within the secure confines of Ponte Vista, this gated community offers an array of amenities, including a pool, recreation center, parks, fitness room, gas BBQs, and a
Exquisite and elegant French Country style single-level home overlooks a breathtaking unobstructed view of Catalina Island. This lovely residence in the “Island View Community” also has its own small seclusion being nestled in a cul-de-sac with an electric-gated entry onto the driveway. Beautiful kitchen with granite counters and stainless steel appliances. Master suite with fireplace and French doors which lead to the backyard. 4 bedrooms, 3.5 bathrooms, dining room, family room, living room and entertaining room. Entertaining room with large custom bookcases, fireplace and step-down wet bar invites strolling into the backyard and adoring the sparkling saltwater swimming pool a
Beautiful 2 story home in a nice secluded well-desired neighborhood, is ready for buyer to customize and make your own!! Nestled among a hillside, with adorning lights and a beautiful brick fascia, this charming home has a great layout, 4 spacious bedrooms; two bedrooms upstairs and two bedrooms downstairs, the Master Bedroom is upstairs and shares a Jack and Jill bathroom with the adjacent spacious bedroom. Enjoy family gatherings in the large living room with a fireplace, enjoy cooking in an open style kitchen with lots of cabinet and counter space and entertain in the large dining and family area overlooking the backyard area or dine al fresco under the patio. Property features ample pa
$1,199,000
4 beds2 baths1,909 sq ft6,312 sq ft (lot)
28551 S Montereina Dr, Rancho Palos Verdes, CA 90275
Great one bedroom end unit overlooking the pool/spa and view in the desirable complex of Harbor Walk. Kitchen features tile countertops, recessed lights and matching appliances. Large living and dining room space with plantation shutters, hardwood floors and attached jack and jill balcony. Bedroom has on-suite bathroom large vanity and walk-in cedar closet. Unit comes with two sub-terrain side by side parking spaces and additional storage off the balcony. Complex features numerous guest parking spaces, lush grounds, pool and spa. Close proximity to restaurants, grocery stores, shopping and quick freeway access.
Discover luxurious living in the heart of the renowned Palos Verdes Peninsula with this tastefully updated corner-unit condo surrounded by lush landscaping and a tranquil community. Bathed in natural light, this spacious upstairs residence spans 1,071 sq. ft. , offering 2-beds, 2-baths, a seamless flow of elegant living spaces, and a balcony - all with expansive views of nature and vibrant foliage. When you step inside you will find a welcoming ambiance enhanced by upgrades, like laminate hardwood floors and neutral-tone paint throughout. The open-floor concept effortlessly connects the living room, kitchen, dining area, and balcony creating an ideal environment for both relaxation and ente
$690,000
2 beds2 baths1,071 sq ft
5927 Armaga Spring Rd Unit H, Rancho Palos Verdes, CA 90275
Welcome to your own slice of paradise perched atop the mesmerizing hills of Los Angeles! Behold this stunning Mid-century modern style residence boasting an incredible panoramic city light view from Malibu to LA Harbor that will leave you breathless. Step inside and prepare to be captivated by the seamless integration of indoor-outdoor living, where every corner of this home is designed to maximize the awe-inspiring vistas of downtown Los Angeles, mountains, and LA harbor. The heart of this 5 bedroom/3 bath home is a recently upgraded open kitchen featuring a sleek bar-top island, quartz countertops, skylight, walk-in pantry, stainless steel appliances and maple-lined cabinetry. With high v
Welcome to 5 Yellow Brick Road, where the allure of a magical and classic street on a private cul-de-sac meets the potential for your dream home! This property offers an enticing prospect for individuals seeking vast potential to embark on a project aimed at revitalization and restoration. Situated on an expansive lot spanning over 20,000 square feet, with 3,884 square feet of living space, it provides ample room for creative endeavors and transformation. Although this home will require extensive updating and repairs, its prime location and impressive features make it a unique opportunity in Rancho Palos Verdes. The main level showcases a primary suite with fireplace, walk-in closet, as wel
Located at the top of the hill in Rancho Palos Verdes overlooking the magnificent Pacific ocean, come in and enjoy your new home, unit #301 at 28121 Highridge Road. Start by stepping through the front door into your amazing hallway entry with beautiful hardwood floors. After kicking off your shoes and setting down your keys, stroll into a large open concept space flooded with natural light and fling open your multiple sliding doors to savor the refreshing ocean breeze. The expanded kitchen boasts a sizable island and is attached to the large dining room and an impressive bar area that will easily accommodate all your guests and have you itching to entertain. Mornings couldn't be more relaxi
$889,000
2 beds2 baths1,338 sq ft
28121 Highridge Rd #301, Rancho Palos Verdes, CA 90275
Discover the pinnacle of luxury living in Rolling Hills Estates within the gated enclave of The Ranch. This exceptional single-level residence offers 4 bedrooms, 5 bathrooms with over 4,200 sq ft of living space on a 18,400 sq ft elevated corner lot. The home also includes a gym, office, pool, spa and a spacious backyard with serene ocean and Catalina views. Step inside to experience the spacious open-concept layout, boasting vaulted open-beam ceilings, skylights, and an abundance of windows, French doors and bifold doors that infuse the home with natural light. Entertain effortlessly in the newly reimagined great room featuring a large bay window, wet bar, and fireplace that seamlessly con
$4,500,000
4 beds4.5 baths4,234 sq ft0.42 acre (lot)
21 Misty Acres Rd, Rolling Hills Estates, CA 90274
Nestled within the serene community of The Gardens, this meticulously maintained 3-bedroom townhouse offers a haven of comfort and convenience. Upon entering, you're welcomed by a spacious living room and elegant formal dining area, complemented by a cozy den just off the kitchen—an inviting space for relaxation or casual gatherings. Step outside to discover a tranquil private patio, providing direct access to the detached 2-car garage, seamlessly blending indoor and outdoor living. Ascend to the upper level, where a vast master bedroom awaits. All three bedrooms are conveniently situated upstairs, ensuring privacy and tranquility. Residents of this community are granted access to exc
Perched on a large 11,937 square foot lot, this home designed by renowned architect Paul Revere Williams represents an exquisite residence quietly situated on a peaceful street in the Seaview Neighborhood. Located steps away from the beach, with nearby hiking trails, oceanfront golfing and a short walk to the exclusive Portuguese Bend Beach Club, this 3 bedroom, 3 bathroom home offers breathtaking ocean views from the moment you walk up the front stairs. Sunlight streams into every room of this home, creating a sense of spaciousness and warmth. The well-thought-out floor plan effortlessly connects the light filled living room, remodeled kitchen, and inviting dining room. The layout of the h
Enjoy EVERY SUNRISE, wind-swept sky, and gentle breeze through an easterly facing UNOBSTRUCTED 180 degree view from a single story home located on a quiet very-low-traffic residential street. In addition to the 1,753 sq. ft. (per assessor) 3 bedroom 2 ½ bath home, there is an attached large fully enclosed Patio/Recreation room containing an additional 350 sq. ft. (approximate)! Who doesn’t need more space for fun, exercise, pets, or office work? The enclosed Patio (Recreation) room is lined with continuous easterly facing windows with double-door interior access to the living room and a glass sliding exterior door access to the adjacent Covered (open) Paved Patio (There is also
Introducing 44 Sea Cove Drive, a luxurious oasis nestled in the prestigious enclave of Rancho Palos Verdes. Crafted by renowned architect Luis de Moraes, this masterpiece offers an unparalleled blend of sophistication, comfort, and coastal living. Spanning over one acre of prime real estate perched atop the majestic cliffs of Abalone Cove, this single-story masterpiece boasts breathtaking views of the Pacific Ocean, creating a serene retreat for discerning homeowners. Step inside to discover a spacious floor plan, adorned with high-end finishes and extravagant lighting, where every corner showcases meticulous attention to detail. The heart of the home is the gourmet kitchen, featuring quart
This area's enrollment policy is not based solely on geography. Please check the school district website for more information.
Elementary schools
Middle schools
High schools
GreatSchools Summary Rating
10/10
Lunada Bay Elementary School
Public, K-5
9/10
Soleado Elementary School
Public, K-5
8/10
Mira Catalina Elementary School
Public, K-5
8/10
Cornerstone At Pedregal Elementary School
Public, K-5
8/10
Rancho Vista Elementary School
Public, K-5
Only showing 5 of
16 elementary schools.
School data is provided by GreatSchools, a nonprofit organization. Redfin recommends buyers and renters use GreatSchools information and ratings as a first step, and conduct their own investigation to determine their desired schools or school districts, including by contacting and visiting the schools themselves.Redfin does not endorse or guarantee this information. School service boundaries are intended to be used as a reference only; they may change and are not guaranteed to be accurate. To verify school enrollment eligibility, contact the school district directly.
What is the median home price in Rancho Palos Verdes?
Homes for sale in Rancho Palos Verdes have a median listing price of $1.8M. Some of these homes are Hot Homes, meaning they're likely to sell quickly.
What are some of the most popular neighborhoods in Rancho Palos Verdes?
Popular neighborhoods include Northwest San Pedro, San Pedro Hill, Walteria, Coastal San Pedro, Valmonte, Malaga Cove, Lunada Bay, South Bay, Harbor, and Riviera.
What is transportation like in Rancho Palos Verdes?
Rancho Palos Verdes, California boasts a well-connected transportation network, primarily dominated by car travel. Traffic levels can be moderate to heavy during peak hours, especially on main roads and intersections. Public transportation is available in Rancho Palos Verdes, with several bus lines serving the community. Additionally, the city is conveniently located near major highways, providing easy access to surrounding areas. Learn more on our Rancho Palos Verdes city guide.
What types of properties are available in Rancho Palos Verdes?
Rancho Palos Verdes, California offers a variety of single-family home types, including ranch-style homes, contemporary homes, Mediterranean-style homes, and modern homes. These homes can be found throughout the city, with some located in gated communities, while others are nestled in the hills or near the coastline. Most properties in Rancho Palos Verdes have three to five bedrooms and were built in various years. To explore different property types for sale in Rancho Palos Verdes, California, use the 'Home type' filter located above the active listings. Customize your search by selecting options like single-family homes, condos, townhomes, and more.
What is life like in Rancho Palos Verdes?
Rancho Palos Verdes, California offers a unique living experience with its breathtaking landscape. Nestled along the coastline, residents are treated to stunning views of the Pacific Ocean and rugged cliffs. The weather is typically mild, with cool ocean breezes and plenty of sunshine year-round. The area provides a range of job opportunities, from tech and finance to healthcare and education. Residents can enjoy a variety of activities such as hiking along the scenic trails, exploring the local parks, or indulging in the vibrant culinary scene.
What are the schools and amenities like in Rancho Palos Verdes?
Rancho Palos Verdes, California, is a city filled with numerous amenities to cater to the needs of its residents. The city is home to a variety of restaurants, offering a range of cuisines to satisfy diverse culinary preferences. For outdoor enthusiasts, there are several parks within the city limits, perfect for relaxation and recreation. Grocery stores are also conveniently located throughout the city, making daily shopping easy and convenient. Additional amenities in Rancho Palos Verdes include fitness centers, libraries, and a variety of retail stores.
In the past month, 28 homes have been sold in Rancho Palos Verdes. In addition to houses in Rancho Palos Verdes, there were also 21 condos, 9 townhouses, and 1 multi-family unit for sale in Rancho Palos Verdes last month. Rancho Palos Verdes is a minimally walkable city in Los Angeles County with a Walk Score of 28. Rancho Palos Verdes is home to approximately 41,471 people and 4,836 jobs. Find your dream home in Rancho Palos Verdes using the tools above. Use filters to narrow your search by price, square feet, beds, and baths to find homes that fit your criteria. Our top-rated real estate agents in Rancho Palos Verdes are local experts and are ready to answer your questions about properties, neighborhoods, schools, and the newest listings for sale in Rancho Palos Verdes. Our Rancho Palos Verdes real estate stats and trends will give you more information about home buying and selling trends in Rancho Palos Verdes. If you're looking to sell your home in the Rancho Palos Verdes area, our listing agents can help you get the best price. Redfin is redefining real estate and the home buying process in Rancho Palos Verdes with industry-leading technology, full-service agents, and lower fees that provide a better value for Redfin buyers and sellers.


 REDFIN IS COMMITTED TO AND ABIDES BY THE FAIR HOUSING ACT AND EQUAL OPPORTUNITY ACT. READ REDFIN'S FAIR HOUSING POLICY AND THE NEW YORK STATE FAIR HOUSING NOTICE.
 United States
 Canada