Welcome to 201 Del Norte, a magnificent Portola Highlands home with light-filled rooms plus an open and airy atmosphere. Offering both style and durability, this updated property boasts gorgeous hardwood floors along with other classic touches that maintain its charm and warmth. The spacious layout provides a smooth progression from room to room. Plus, the transition between indoor and outdoor living is seamless, with the family room opening onto an expansive deck for easy al fresco dining and entertainment. The 4 bed, 3 bath floor plan features a beautiful primary suite plus a thoughtfully designed in-law suite, complete with separate entrance and all the amenities. This wonderful home pro
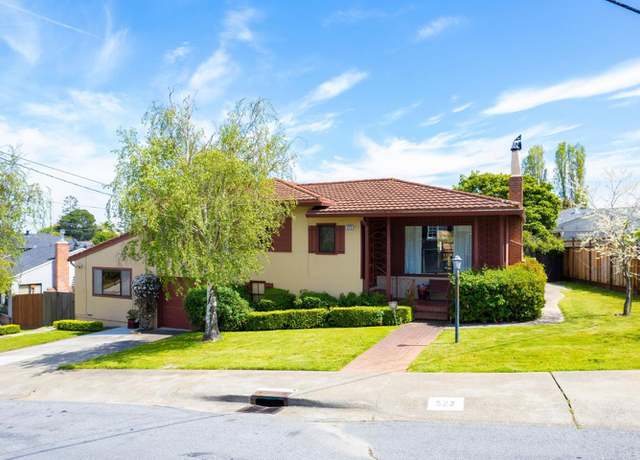
Discover a gem in the heart of Capuchino, Millbrae! This meticulously maintained corner-lot home offers prime location & endless possibilities. Close to San Bruno Park & Downtown areas, it's a hub of convenience. Commuting is a breeze w/ quick access to freeways. This residence provides access to highly rated schools. Inside, bright & spacious living areas flow seamlessly, w/ a charming fireplace. 2 bedrooms, a den/office, & a separate in-law unit provide flexible living options. Outside, enjoy a lush backyard oasis perfect for relaxation/entertaining. Don't miss this chance to make this home your own! | Main Living Area: 1,255 Sf * | Attached In-law Unit: 635 Sf * |
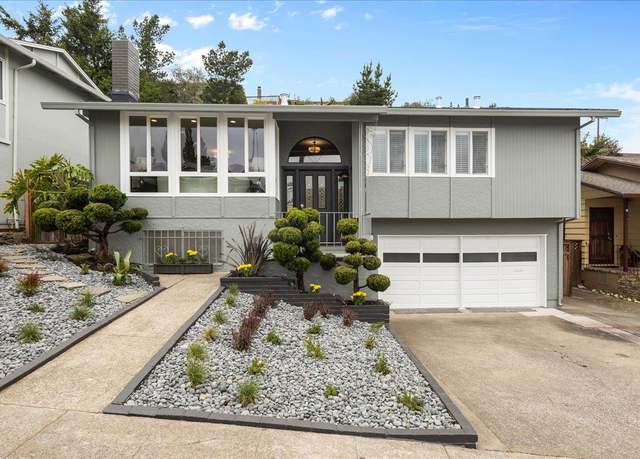
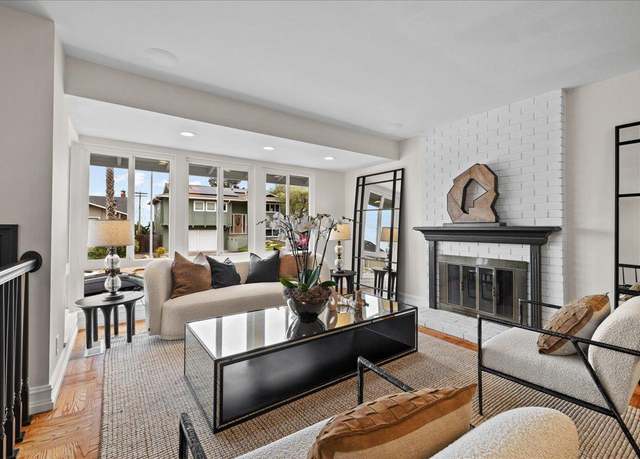
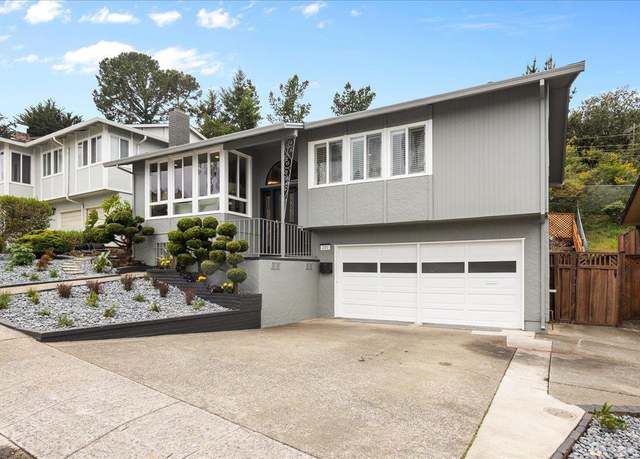
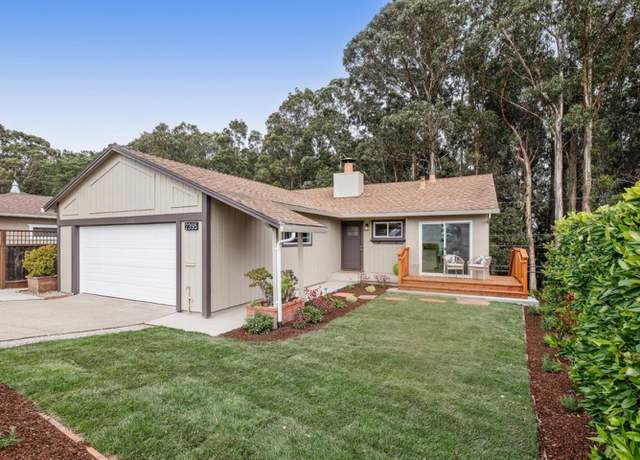
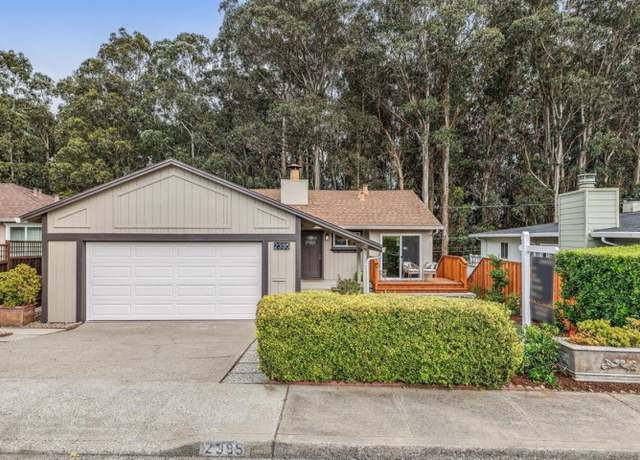
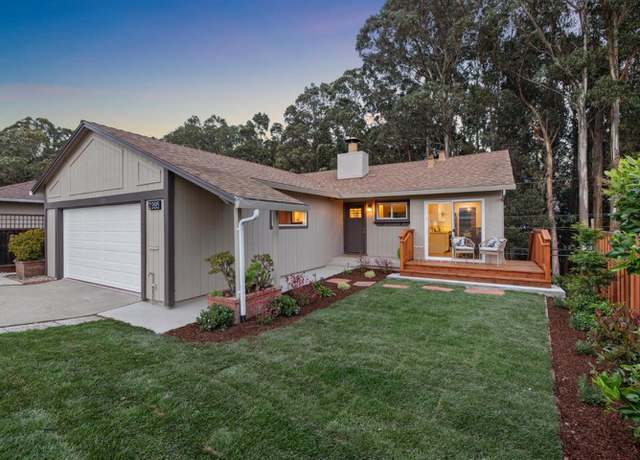
In highly desirable Crestmoor Park, near hiking trails with ocean and bay views, this recently updated home brings the outside into nearly every room from large windows showcasing the outdoors and filling the home with natural light. Assets include refinished oak floors, freshly painted interior and exterior, new lighting and exquisitely remodeled kitchen and baths with pristine stone and tile finishes. The two-level layout features a living room with fireplace and dining area with wall of windows flaunting a grove of eucalyptus trees, and bright eat-in kitchen with quartz counters, stainless steel appliances and French door to the front garden. Two bedrooms, including the primary, are on t
Opportunity awaits at this beautiful studio residence in Peninsula Place, a coveted pet-friendly community just steps from shopping, dining, parks, and scenic hiking trails. Amenities include 4 pools, fitness center, tennis courts, spa, and convenient laundry facilities. Nearby attractions include Bay Hill Shopping Center, Commodore Park, and Sweeney Ridge hiking trails. Peninsula place is great for commuting, with quick access to 280, 380, Caltrain, and BART.
Welcome to your elevated rancher retreat nestled in the sought-after Millbrae Meadows neighborhood! This spacious single-family home offers a perfect blend of comfort and sophistication. Step inside to discover newly refinished hardwood floors and a freshly painted interior, setting the stage for a warm and inviting atmosphere. Entertain guests with ease in the expansive living room, with access to a deck overlooking the lush backyard. The kitchen is a delight, boasting new countertops and at the heart of the combined dining and family room area. On the main floor, three bedrooms await, including a primary suite complete with a large walk-in closet. The hall bath ensures convenience for all
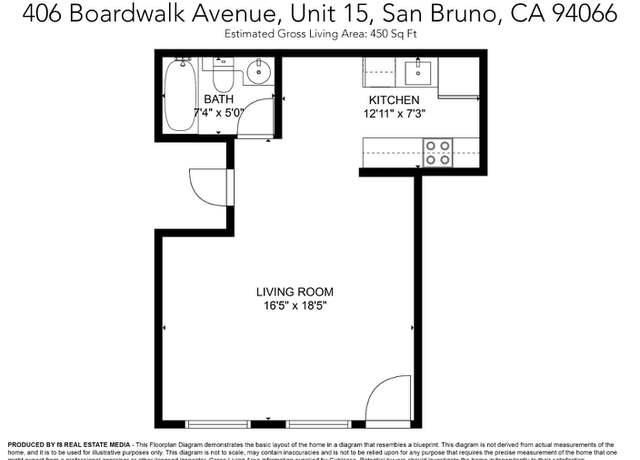
Beautiful condo 1bed/1bath in a very nice community in San Bruno. New painting, new flooring, new carpet, new kitchen countertop. .. etc. Easy access to 280 and 101.
Built in 1944 this sweet fixer sits across from a greenbelt of undeveloped land and one house away from the local playground offering unusual distance from neighbors and a park-like setting in the heart of everything. Expansive backyard with grass and fruit trees, a detached two car garage, and ample off street parking leave room to add an ADU or to expand the structures existing footprints. Please DO NOT go on the property - surveillance cameras are in use. New appliances, renovated bathroom, and updated electrical are being added. Just minutes to San Mateo Avenue, abundant with boutique eateries, mom and pop shops, and historic businesses. Walking distance to BART and the Centennial Way b
This lovely junior 1 bedroom unit is good for first time buyers or investors since unit can be easily rented out. Great location and move-in ready. Unit has 1-car designated parking and additional guess parking pass. Enjoy this most desirable pet-friendly community with a wide range of amenities: swimming pools, security patrol, hot tub and spa, fitness center, tennis courts, recreation room, and club house. Close proximity to YouTube/Google, Commodore Park, Walmart Headquarters, Bayhill Shopping Center, Tanforan Mall, restaurants, SFO Airport, BART/ CalTrain and easy access to 280, 380, 101 freeway.
Elevated ranch-style home, Great potential in this 3 bedroom, 2 bath house, It needs updating to become your ideal home. Near HYWS 35, 280, and 101. Minutes to SFO, and SF downtown. This is a probate sale and needs court confirmation. The property is being sold in its AS_IS condition.
Welcome to 356 Hazel Ave. an incredible duplex in the Huntington Park neighborhood in San Bruno. The property was gut renovated approximately 10 years ago and features a 3 bedroom 1 bathroom unit and a 1 bedroom 1 bathroom unit. The units are light flooded with views of the bay. They have engineered flooring, stainless appliances and granite kitchen and bathroom counters. The property features upgraded electrical, newer roof, large elevated pressure treated deck and beautiful backyard. The 1,136 square foot main home has a living room, dining room, beautiful fireplace, and large deck. This fantastic asset features a WalkScore of 79 (Very Walkable) and is in close proximity to Crystal Spring
Step into luxury living with this remodeled one-bedroom gem nestled in the sought-after Peninsula Place community. Ideal for pet lovers, this exquisite condo offers a seamless blend of convenience and tranquility, just moments from vibrant shopping, delectable dining, and picturesque hiking trails. Indulge in resort-style amenities, including four pools, a fitness center, tennis courts, spa, and sauna, promising endless relaxation and recreation. Inside, discover modern elegance with scratch and water-resistant vinyl plank floors, complemented by chic fixtures and ample natural light. Retreat to the spacious bedroom featuring a coveted walk-in closet, while the back deck offers serene views
Experience resort-style living at its finest within the heart of the highly sought-after Shelter Creek Community. Nestled on the top floor, this exquisite 1-bedroom condo is a haven of comfort & sophistication. Spacious living area flooded with natural sunlight, courtesy of the top-to-floor sliding door that opens to a private balcony. Kitchen has been tastefully upgraded with stainless steel appliances, repainted cabinetry, & new LVT flooring. Dual closets provide ample room for your personal belongings. Bathroom showcases a generously sized vanity mirror. Amenities elevate your living experience, offering an impressive array of features, such as an EV charging station, both ind
The most convenient location in San Bruno. Walking distance to downtown San Bruno. Close to shops, supermarkets, restaurants and more Few minutes get on Highway 101, 280 and 380. Safe and friendly neighborhood. Parking on your own driveway or garage. Enjoy beautiful mornings at your own front porch. Newly remodeled interior and exterior. Come and check out the gorgeous kitchen and bathrooms. Natural lights throughout the house. The 3rd Bedroom facing the back yard provides a garden view with privacy. Fruit trees in backyard. Spacious backyard is peaceful with low maintenance.
Experience the epitome of tranquility in this exquisite top-floor unit boasting picturesque views of Shelter Creek Condominiums' verdant garden oasis. Nestled amidst the breathtaking natural beauty, this residence offers a spacious bedroom complemented by a luxurious bathroom featuring an expansive vanity area and two generous closets. Discover a serene haven away from the Bay Area's frenetic pace, yet conveniently located just moments from major highways including 280 and 101. With YouTube San Bruno, Walmart eCommerce Corporate, and Tanforan Shopping Center in close proximity, as well as easy access to San Francisco State University and Downtown San Francisco, this idyllic retreat seamless
THIS CONDO, offers refreshing designer details. The secure building offers inviting amenities that include exercise room, sparkling pool, a game/community pool, and relaxing open garden space. Recently refreshed. .. this property is move-in-ready. The open floor plan has sleek remodeled kitchen with a large eating bar that facilitates entertaining and daily routines, designer lighting, and stainless steel appliances. The living/dining areas flow together easily and share a painted stone fireplace and balcony and also plenty of room for a work at home desk. There are 2 bedrooms and 2 full baths. The primary oversized bedroom enjoys an ensuite bath, 2 closets and private balcony. The mid-peni
Step into your serene retreat, where modern convenience meets tranquility. This 1bed/ 1bath gem boasts a recently renovated kitchen with like-new appliances, elegant countertop and plush carpeting throughout. Modern double paned window and sliding door. Enjoy natural light and a balcony with southwest orientation, inviting harmony and prosperity into your home. Outside, indulge in resort-style living with two outdoor pools, an indoor pool, tennis courts, clubhouse, gym, and sauna. EV charging stations and solar panels align with your eco-conscious lifestyle. Bay Hill Shopping Center on short distance. Conveniently located in the Silicon Valley Corridor, with easy access to tech hubs like th
BUYERS!! Condo prices are down, if interest rates go down, prices go up. No competition. Isn't that what you have been waiting for? NOW IS THE TIME TO MAKE THAT MOVE!!! LARGE 1 BEDROOM 1 BATH COURT YARD LOCATION, LIGHT AND BRIGHT SOUTHERN EXPOSURE, SHELTER CREEK HAS A LOT TO OFFER; GREAT MGMT STAFF, LOTS OF AMENITIES (3 POOLS, HOT TUB, TENNIS COURTS, EXERCISE ROOM, SAUNA, BILLIARDS AND A LARGE SOCIAL CLUB HOUSE WITH TABLE TENNIS, WIFI AND A BAR FOR THOUGH SPECIAL EVENTS) CONVENIENTLY LOCATED TO HWY 280,380 AND 101, EV CHARGING STATIONS, SOLAR ELECTRICITY AND MUCH MORE
Experience the epitome of resort-style living at 6348 Shelter Creek Lane in San Bruno. This recently refreshed 1-bedroom, 1-bathroom unit on the top floor of building 6 offers a fresh ambiance with new carpeting, new kitchen flooring, fresh paint and updated light fixtures throughout. Natural light fills the living room, streaming in from the balcony overlooking the serene courtyard. Enjoy the convenience of a designated parking space and storage locker. Embrace the lush surroundings with exquisite landscaping, water features, and verdant greenery. The complex features an array of amenities including indoor and outdoor pools, hot tubs, a clubhouse, fitness center, pool and ping pong tables,
Lovely 1bed and 1bath unit located in San Bruno's premier condo community of Shelter Creek. This unit is located at 3rd floor and have ambient light with a spacious patio overlooking a peaceful water fountain. Additional storage room on the same floor. Building 3 is nicely located near clubhouse and main outdoor and indoor pools. One assigned parking spot. Great location close to Bayhill Shopping Center and easy access to public transportation and major highways. The community is well maintained and highlighted by mature landscaping, water features, and serene paths. Amenities include but not limited to indoor pool, multiple outdoor pools, spas, gym, club house, billiard room, and tennis co
Charming ground floor studio with a private patio. This unit has one designated parking space and a storage locker. Shelter Creek has many amenities to offer, indoor and outdoor pools, clubhouse, exercise room, tennis courts, picturesque landscaping and much more. Easy access to freeways, great proximity to shopping and transportation.
BUYERS!! Condo prices are down, if interest rates go down, prices go up. No competition. Isn't that what you have been waiting for? NOW IS THE TIME TO MAKE THAT MOVE!!!. If you want to be close to the amenities, search no more! This is your unit. This large 1 bedroom/1 bath corner unit has fresh paint and all new flooring. It features stainless steel appliances and all new light switches and outlets. It's move in ready! Come enjoy all the amenities Shelter Creek has to offer: 3 pools, hot tub, tennis courts, exercise room, sauna, billiards and a large social clubhouse with ping pong tables, Wi-Fi, and a bar for special events. EV charging stations, solar electricity and much more. Convenien
This property is two buildings on a two separate parcels. 8 units, 1 studio, 1 one bedroom, and 6 two bedroom apartments. All utilities are separately metered. 7 of the 8 units are completely remodeled with new appliances, counters, cabinets, floors, doors, carpets, tile, paint, light fixtures, etc. Location is convenient to shopping, transportation, freeway access and BART.
BUYERS!! Condo prices are down, if interest rates go down, prices go up. No competition. Isn't that what you have been waiting for? NOW IS THE TIME TO MAKE THAT MOVE!!! Location, location, location!! This large top floor light and bright unit is overlooking the courtyard, which gives it a majestic feeling. Peace and quiet atop the redwood trees. New flooring and fresh paint is completed. Stainless steel appliances, walk-in closet with organizer. close to all the amenities. Come enjoy all the amenities Shelter Creek has to offer: 3 pools, hot tub, tennis courts, exercise room, sauna, billiards and a large social clubhouse with ping pong tables, Wi-Fi, and a bar for special events. EV chargin
One of a kind Multi-generational home. Two homes under one roof. Live upstairs and enjoy significant rents from your tenants downstairs. The home boasts 7 Bedrooms and 4 full bathrooms. Downstairs has original hardwood floors, a game room and and additional living spaces. Upstairs has high 10 ft ceilings engineered hardwood floors recessed lighting with beautiful crown molding with a wet bar. The upstairs kitchen features granite countertops and an island. A laundry room located upstairs and another one located downstairs. The previous owner added the master bedroom and bathroom and a second fireplace in the 1980's. In 2001 the plans for expansion started with the addition of a playroom dow
This area's enrollment policy is not based solely on geography. Please check the school district website for more information.
Elementary schools
Middle schools
High schools
GreatSchools Summary Rating
8/10
Green Hills Elementary School
Public, K-5
7/10
Portola Elementary School
Public, K-5
7/10
Monte Verde Elementary School
Public, K-5
7/10
John Muir Elementary School
Public, K-5
5/10
Lomita Park Elementary School
Public, K-5
Only showing 5 of
7 elementary schools.
School data is provided by GreatSchools, a nonprofit organization. Redfin recommends buyers and renters use GreatSchools information and ratings as a first step, and conduct their own investigation to determine their desired schools or school districts, including by contacting and visiting the schools themselves.Redfin does not endorse or guarantee this information. School service boundaries are intended to be used as a reference only; they may change and are not guaranteed to be accurate. To verify school enrollment eligibility, contact the school district directly.
San Bruno, California boasts a well-developed transportation system that includes both private and public options. Car owners will find that traffic levels can be high during peak hours, especially on weekdays. Public transportation is readily available, with Caltrain and BART services providing convenient travel options. Additionally, San Bruno is conveniently located near major highways and freeways, including the I-280 and US-101, offering easy access to surrounding areas. Learn more on our San Bruno city guide.
What types of properties are available in San Bruno?
San Bruno, California offers a variety of single-family home types, including ranch-style homes, split-level homes, and contemporary homes. These homes can be found throughout the city, with ranch-style homes typically built in the 1950s and 1960s, split-level homes built in the 1970s and 1980s, and contemporary homes built in the 1990s and 2000s. To explore different property types for sale in San Bruno, California, use the 'Home type' filter located above the active listings. Customize your search by selecting options like single-family homes, condos, townhomes, and more.
What is life like in San Bruno?
San Bruno, California offers a unique living experience with its charming surroundings. The landscape of this region is characterized by picturesque hills and breathtaking views. The weather in San Bruno is enjoyable, with mild winters and comfortable summers. The city provides a range of job opportunities across various industries, ensuring career growth and stability. Residents can indulge in a plethora of activities, including outdoor adventures, cultural events, and a vibrant nightlife scene.
What are the schools and amenities like in San Bruno?
San Bruno, California offers a variety of public amenities for its residents. The city is home to a number of restaurants, providing a wide range of dining options to suit every taste. For outdoor enthusiasts, there are several parks available for leisure and recreational activities. Grocery stores are also plentiful in San Bruno, ensuring residents have easy access to daily necessities. Additionally, the city offers other amenities such as libraries, fitness centers, and public transportation services.
In the past month, 15 homes have been sold in San Bruno. In addition to houses in San Bruno, there were also 22 condos, 1 townhouse, and 1 multi-family unit for sale in San Bruno last month. San Bruno is a moderately walkable city in San Mateo County with a Walk Score of 56. San Bruno is home to approximately 40,705 people and 12,486 jobs. Find your dream home in San Bruno using the tools above. Use filters to narrow your search by price, square feet, beds, and baths to find homes that fit your criteria. Our top-rated real estate agents in San Bruno are local experts and are ready to answer your questions about properties, neighborhoods, schools, and the newest listings for sale in San Bruno. Our San Bruno real estate stats and trends will give you more information about home buying and selling trends in San Bruno. If you're looking to sell your home in the San Bruno area, our listing agents can help you get the best price. Redfin is redefining real estate and the home buying process in San Bruno with industry-leading technology, full-service agents, and lower fees that provide a better value for Redfin buyers and sellers.


 REDFIN IS COMMITTED TO AND ABIDES BY THE FAIR HOUSING ACT AND EQUAL OPPORTUNITY ACT. READ REDFIN'S FAIR HOUSING POLICY AND THE NEW YORK STATE FAIR HOUSING NOTICE.
 United States
 Canada