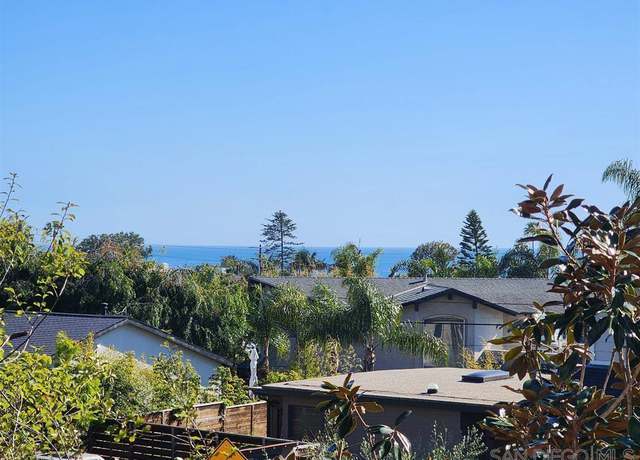
Unique Opportunity to enjoy ocean views and coastal breezes from this 3 bedroom, 3 bath twin home with 1 bedroom companion unit located in the Composer District of Cardiff by the Sea. Each unit features hardwood floors in living room, granite counters in kitchen and bath, nicely sized laundry room in the upper unit and stack system for the 1 bedroom. Each unit has a 1 car garage and 1 additional parking space. West of I-5 location is just a easy walk to local restaurants, Cardiff Town Center, Seaside Market, great surfing at Cardiff Reef or hiking trails along the San Elijo Lagoon.
Welcome to a rare Ocean View opportunity nestled on a highly sought-after street in Leucadia, presenting the epitome of coastal living at its finest. This extraordinary custom residence with cul-de-sac location and interior courtyard provides an unparalleled sense of privacy and seclusion. This residence is more than just a home; it's a lifestyle. Walk to popular surf spots such as Grandview and Ponto Beaches. Enjoy the proximity to the new Alila Marea Beach Resort and renowned restaurants along Highway 101. Immerse yourself in the allure of this property, where exclusivity meets craftsmanship. This contemporary custom Italian Villa, boasting a Santa Barbara stucco finish was crafted with
* COMING SOON * Just west of I-5, nestled within the tranquil Leucadia Village community, this captivating New England-style twinhome offers a serene retreat for the discerning buyer. Professionally designed landscaping along an expansive 11-acre greenbelt, provides privacy in an idyllic atmosphere. Step inside to discover a beautifully appointed kitchen with sleek stainless steel appliances, dazzling quartz countertops, and a convenient island bar. The spacious living room is complemented by hardwood flooring, an expansive vaulted ceiling with windows that bathe the space in natural light, French doors that beckon you to the lush outdoor garden patio. Your personal sanctuary awaits in the
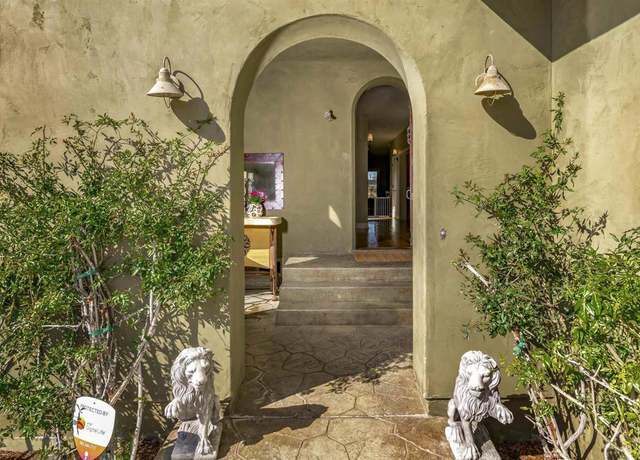
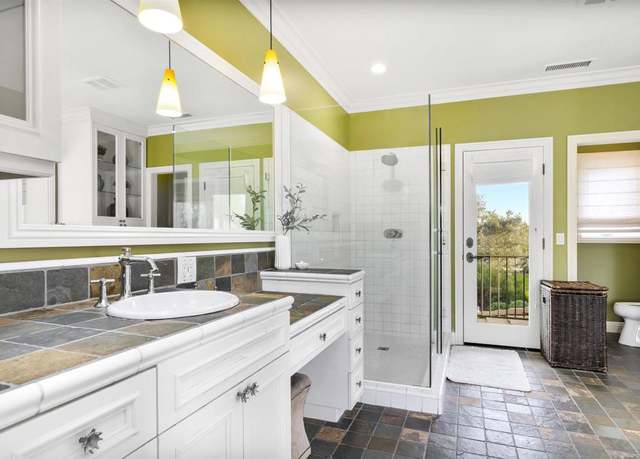
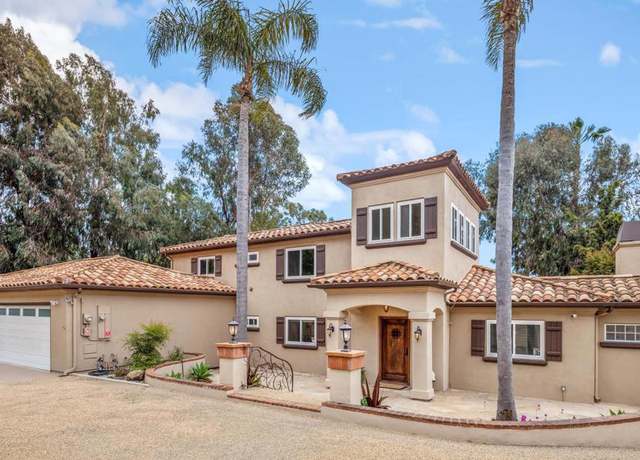
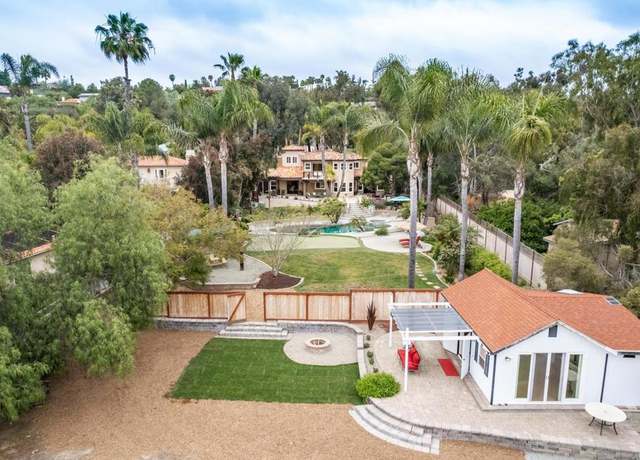
Escape to your own private paradise nestled on nearly 2 acres in the beautiful enclave of Olivenhain. A long driveway guides you to this custom Mediterranean 5-bedroom residence, thoughtfully designed to harmonize with its natural surroundings. Positioned far from the road, the home offers unrivaled privacy, while the expansive backyard unfolds as an oasis, beckoning you to unwind and indulge in the joys of outdoor living. Step inside to discover a world of comfort. Rich hardwood floors span the interiors, leading you through an open and airy floor plan. The inviting living room boasts a cozy stone fireplace and high wood-paneled ceilings, creating a warm ambiance for gatherings with loved
Once in a lifetime and very rare . 62 acre development opportunity, or ultimate compound home site, in West Cardiff’s Composer District. Zoned R11, potentially allowing a build of up to 8 (possibly more) units per feasibility study done with engineer and architect. Ideally located, adjacent to San Elijo Ave, this lot is just minutes from the heart of Cardiff and neighbors Cardiff Elementary School. Seaside Market, the Coastal Rail Trail, top notch restaurants, cafes, Cardiff State Beach and it’s epic surf is all within a short stroll. A single family 3 Bed, 3 Bath home with a 2 car garage and additional large work shop currently sit on the oversized lot. The lush vegetation, sea
Welcome to the premier panoramic view home in the prestigious gated community of Kings Bridge Country Estates, where every detail is designed to elevate your living experience. Upon stepping through the front door, expansive windows immediately draw your attention to the picturesque backyard pool and the breathtaking westerly valley views. The dramatic entry leads you into a spacious living room with soaring ceilings, seamlessly blending indoor and outdoor spaces to create a sense of openness and tranquility. Adjacent to the living area, a large separate dining room offers spectacular westerly views of the canyon and sunset views, perfect for hosting memorable gatherings. Enhancing the eleg
Truly the BEST of CARDIFF COVE!!! Panoramic breathtaking lagoon and ocean views west of I-5. Savor spectacular sunsets from the Patio and the Balcony, luxuriate in the stunningly remodeled home. Indoor-outdoor living you dream of. Double paned windows, wood flooring, high end appliances. Furnishings negotiable. Cardiff Cove includes Community Pool, Spa, Clubhouse, extensive walking trails and Lookout Point. Minutes to San Elijo or Cardiff State Beach, hiking galore in & around San Elijo Lagoon, dining opportunities abound. Walk into the light and bright great room with westerly views and ocean breezes pouring in. Newly added full bath down plus under-stairs storage greatly expands th
Experience breathtaking ocean views just steps away from Moonlight Beach. This meticulously crafted residence, custom-built in 2013, boasts a thoughtfully designed layout. The main house features two bedrooms downstairs and an awe-inspiring primary suite on the upper level alongside a spacious kitchen, inviting living and dining areas, and an expansive outdoor balcony. A detached guest house rests above the three-car garage. Inside, tall ceilings flood the interiors with natural light, creating an ambiance of spaciousness and serenity. Indulge in the ultimate coastal lifestyle on the expansive rooftop deck, where panoramic ocean views await. Embrace the convenience of being mere moments awa
Fantastic single-story home in Spyglass! This 1739 Square foot home, featuring 3 bedrooms and 2 newly remodeled bathrooms, has vaulted ceilings, mature landscaping, and has a south facing backyard nestled above the canyon with great views. Double doors at the entry lead into a formal living room and dining room. The light and bright kitchen is complete with stainless steel appliances including a professional Thermador 6 burner gas range, granite countertops, new backsplash, and is open to the family room with gas fireplace and a dining nook. Updates in in 2024 include new luxury vinyl plank flooring throughout, AC & heating, bathrooms, and backyard with new BBQ and fridge, pavers, irr
P * A * N * O * R * A * M * I * C OCEAN & SUNET VIEWS! Top of the hill! The Crown Jewel location of Park Place Bluffs. Drink in the views from morning until sundown. This turnkey 3BR/2.5 townhome does not disappoint. Updates include: Remodeled kitchen w/ granite, SS appliances, newer crisp white cabinetry, gas stove & farm sink. Upgraded attic furnace, A/C ready, new thermostat and , newer front screen door, new water heater, double pane windows & sliders, 3 solar tubes with lighting, new roof, hardwood floors, newer garage door and mechanism with outside keypad entry. Large, spacious West facing patio area with outdoor bar area, sink and refrigerator, ceiling fan, slab fo
Nestled in the quintessential Cardiff community, this charming Park Place Bluffs condo is located just minutes from the beach. Offering amenities galore, this cute 2 bedroom, 2 bath unit is a perfect place to call home. Single-level end unit with no neighbors above you, this move-in ready home has been upgraded with central air conditioning, ceiling fans, bamboo flooring, dual pane windows and recessed lighting. It also offers a gas fireplace, in-unit laundry, large private patio, 1-car garage and a second assigned parking spot. HOA amenities include pool and spa, off-leash dog park, sand volleyball court, large nature preserve with walking trails, baseball fields and RV parking. Schools ar
$859,000
2 beds2 baths922 sq ft1,416 sq ft (lot)
1261 Caminito Septimo, Cardiff By The Sea, CA 92007
Welcome to Encinitas Enclave, a rare offering from a newer community completed in 2019 comprised of only 19 luxury homes in total. This modern, ultra-custom, SINGLE LEVEL, practically brand new home tucked away in the heart of Encinitas sits on a corner lot and offers everything you can imagine. This particular model has an ideal floorpan with three bedrooms, all ensuite, an office/optional bedroom and an open floor plan. Features include engineered hardwood throughout, custom lighting, drapery, shades and shutters throughout, tankless water heater and built-in, side-by-side SubZero refrigerator and freezer. The backyard was completed in 2020 and includes a new Premiere Pool and Spa with in
Nestled in the charming coastal community of Cardiff by the Sea, this exquisite two-story residence is a testament to coastal living at its finest. The updated kitchen, featuring high-end stainless-steel appliances, a convenient walk-in pantry, wine fridge, and a breakfast bar, is ideal for casual dining or entertaining. The open concept living room, adorned with a modern stacked stone fireplace, seamlessly flows out to the covered patio and tiered backyard, offering a perfect setting for indoor-outdoor SoCal living. The main level also hosts a dining room, 1 bedroom, and a full bath, providing convenience and flexibility for everyday living. Additionally, a separate studio/guest house with
$2,200,000
4 beds3 baths2,496 sq ft9,000 sq ft (lot)
1927 Playa Riviera Dr, Cardiff By The Sea, CA 92007
Beach Life Living!! Is it your dream to have a cottage steps from the beach where you can enjoy peaceful walks in the sand, surfing, relaxing and the sunsets all year? Or maybe you’re looking for a beach house just for the summer and then rent it out the rest of the year to pay for your summer vacation? This adorable remodeled, two-bedroom, one large bath, updated throughout beach cottage, is surrounded by million-dollar homes and is only 800 feet, a 3 minute walk, to the famous Beacon’s Surf Beach in Leucadia. You see the price and it even gets better, like most people you might immediately reject the idea of paying park rent on your home but if you consider you do not pay prop
A gated driveway welcomes you to this beautiful single level estate with panoramic ocean views, just minutes from world famous Moonlight Beach. The penetrable paver courtyard entry featuring a stunning water feature and garden sculptures leads to the 4 year old home that has been meticulously maintained by the original owner. A covered porch frames the house and as you enter and step onto the porcelain plank floor that runs throughout the house, you are immediately impressed with the openness and quality surrounding you. You will be drawn to the kitchen as it is the heart of the home. Top of the line Thermador appliances: built-in 48 inch refrigerator, a 6 burner gas stove top plus griddle,
Amazing location in Encinitas, close to shopping, beaches and restaurants. This 2 bed 2 bath upper end unit has a very private feel, a well thought out remodel masterfully utilized the space available to create a very open and livable floorplan which enlarged the kitchen compared to other units. The primary bedroom has an ensuite, walk in closet and south facing windows. Updates include quartz countertops, bamboo wood flooring, stainless steel appliances, abundant pantry storage, AC, full in unit washer and dryer and updated bathrooms. The community amenities include two hot tubs, bike storage and easy access to I-5. Carport parking with additional storage plus parking pass. Located less th
Nestled within the prestigious Encinitas Ranch, this meticulously maintained home offers breathtaking views of the golf course, lake, and ocean. With 4 bedrooms and 4 full baths, this expansive residence seamlessly combines luxury and functionality. The main level features a convenient bedroom and full bath with a built-in Murphy bed, providing the option of a downstairs office/bedroom combo. The flexible floor plan includes an optional 5th bedroom currently utilized as a spacious office upstairs. Enjoy the benefits of a fully paid solar system with 31 panels, separate HVAC systems for upstairs and downstairs, a comprehensive whole-house water system, tankless water heater, and epoxy floori
Welcome to your private oasis in the coveted Composer District of Cardiff by the Sea. This gated family home features four bedrooms, recently upgraded primary and secondary bathrooms that offer a spa-like experience, and an updated chef's kitchen featuring Caesar stone countertops, new cabinets, a Bertazzoni range, and top-of-the-line appliances. Enjoy ocean views from the second floor. Other upgrades include new HVAC, vinyl fencing, turf, and interior and exterior doors. The home also boasts an office area, perfect for remote work or study. The backyard is an entertainer's delight with a large deck, low-maintenance turf, and a fire pit. Just steps away from world-class surf, Seaside Market
With Panoramic ocean views from La Jolla to Dana Point + walk to beach and Cardiff Town Center location, this very special custom home provides the ideal Southern California lifestyle that you have been looking for. Enjoy spacious great room concept plan with large living / dining area, idyllic cook's kitchen with "wild sea" granite entertaining/eating bar, and all enjoying panoramic ocean views of Catalina and San Clemente Islands. Custom built for present owner by one of Encinitas/Cardiff's premier builders, and never before on market, this townhome offers a rare opportunity to achieve all of the benefits it offers. Master suite on entry level with French doors leading out to pr
Charming home with the largest floorplan in Village Park. This home has a picturesque yard that is perfect for gatherings and garden enthusiasts with mature fruit trees and a lush lawn. The home is convienent to everything, , including great resturants, shopping and the one and only Moonlight Beach. This home offers endless potential for renovation and customization to create your own unique living space. Bring your vision and creativity. There's room for a possible ADU above the garage as many owners have added to their Village Park homes. San Diego Magazine just did an article about why Village Park is a great place to live in 2024.
Call/Text 760-704-9718 for details and showings. A surfer& apos; s dream home. Minutes from the beach, shopping, schools, public transportation and more. Walkable community and great for bicyclists too. Perfect for year round living or a vacation home. Works great as a rental during summer. West of Coast Highway 101. New flooring and remodeled bathroom. This is located in a land leased park. Monthly space rent is $2,100 - Beach Neighborhood. Additional Details: Built 2001. Composition Roof. Full kitchen with gas stove, remodeled bathroom, new laminate flooring, sewer, gas heater, garbage disposal, refrigerator, microwave, range/oven, new ceiling fans, new patio deck, street parking. (Th
This is California living! Nestled in the serene hills overlooking the sparkling Pacific Ocean, this exquisite two-story home offers luxury living at its finest. With 3 bedrooms, 2 1/2 bathrooms, 3 car garage, fireplace, pool, spa and nearly ½ acre of lush landscape, get ready to live the good life! Enjoy panoramic vistas of the shimmering ocean from nearly every room in the house. Whether you're sipping your morning coffee or hosting friends at sunset, the views will take your breath away. Step inside to discover a light-filled interior designed for modern living. The open-concept layout connects the living, dining, and kitchen areas, creating an inviting space for entertaining or
Welcome to your dream home in the heart of Encinitas! Nestled within a gated community on a tranquil cul-de-sac, this stunning single-story has been fully remodeled to offer the epitome of luxurious coastal living. Boasting an unbeatable location, just 2 miles from the pristine shores of Moonlight State Beach and less than a mile from both the YMCA and Encinitas Ranch Golf Course, convenience and leisure are at your fingertips. Upon entering, you'll be greeted by an abundance of natural light that illuminates the spacious interior. The office has been thoughtfully transformed into a versatile third bedroom, offering flexibility to suit your lifestyle needs. Every detail has been meticulousl
This light and bright upstairs unit offers a fantastic opportunity to own walking distance to downtown Encinitas, Beaches, Restaurants, Yoga studios, Train Station, and much, much, more. Owner occupants and investors alike will appreciate the recent remodel with newer kitchen, in unit laundry, and multi-zone heating and AC. The property is west facing with unbelieveable sunsets, and quick accessibility to both the freeway and the beach. The complex is nearly 10 acres of park-like setting including green belts, a pool, and dog park. The property has THREE assigned parking spaces.
Absolutely stunning 3BD + Den/ 3BA beachy chic Flair Encinitas residence oozing with character and embraced in positive energy and warmth. Immediately upon entry you are welcomed by a peaceful color palette, gorgeous luxury vinyl plank floors that extend throughout the home, and designer touches in all the right places. Expansive 2-story vaulted ceilings in the open family room with fireplace offers plenty of natural light and areas to relax or play. White shaker cabinetry in the kitchen (see supplement) contrasts well w/ the dark granite countertops/ new counter depth fridge/ microwave/ dishwasher opening up to the convenient dining area. Coveted downstairs BD and full BA offer flexibility
Venture into a realm of unrivaled opulence, a mere hop from untouched beaches and the fabled Alila Marea Resort and Spa. Tucked away in a fortified, five-dwelling enclave, this splendid abode is a testament to coastal grandeur, weaving a tapestry of elegance and comfort over 5,299 square feet. Each of the five sanctuaries within promises a deep connection with tranquility, with private ensuites offering a secluded haven of luxury. Upon entering the grand foyer, high ceilings and an expansive layout signal the start of an exclusive sojourn. At the heart, a culinary realm beckons with stainless steel marvels, dual dishwashers, granite majesties, and an island of considerable allure. A custom
This highly sought after single story home is located in the desirable neighborhood of "Willow Creek". Positioned at the very end of a cul de sac and backing to open space sits this Mediterranean style 4br/2ba home. Open living/dining area with vaulted ceilings. .. .family room w/ fireplace opens into the kitchen and informal eating nook. Lots of windows to let in the natural light. Vaulted ceiling in the primary suite and recently remodeled bath. Three additional bedrooms and bath. .. along with a separate laundry room. Attached two car garage with automatic opener. Air conditioning. All dual pane windows. Lush gardens and fully fenced backyard. Just a short walk to Scott Valley
Welcome to a newly renovated 4-bedroom, 3-bathroom home in the heart of Encinitas. With designer touches throughout, this residence offers a bright and airy ambiance, amplified by an abundance of natural light. Step inside to discover a brand new kitchen boasting modern cabinets, appliances, and countertops. The open kitchen with an island seamlessly flows into the backyard, perfect for indoor-outdoor entertaining. The living room, complete with a cozy fireplace, opens up to a formal dining room, creating an ideal space for gatherings. The family room also adjoins the kitchen, offering a seamless layout for everyday living. Spanning 2081 square feet, this home offers a large primary bedro
Charming single story, 3 bedroom, 2 bath detached Encinitas home ideally situated on a coveted cul de sac. Flooded with natural light, vaulted ceiling, wood floors, with fresh interior paint and carpet. Bright kitchen, expansive living room flows to a private backyard perfect for indoor/outdoor living, relaxing, fun, and entertaining. Steps to Flora Vista Elementary School, community walking paths, pool, and multiple play lots. Complete with two car garage and AC.
A true gem of a home in a rarely available neighborhood! You are walking distance from some of San Diego’s top surf spots, shops and restaurants on the 101, and easy access to the 5. Yet, you get the benefit of a recently developed incredibly well-maintained enclave within West of 5 Encinitas. This turn key 2,843sqft, 4 bed, 4 bath home was built by Shea Homes in 2015. The thoughtful layout provides a main floor bedroom and bathroom and the open concept main floor encourages an indoor/outdoor lifestyle complete with 2 sets of wide, bi-fold doors. The kitchen is complete with a large island and built-in commercial grade appliances. An over-sized 2-car garage allows for storage of all
Welcome to this stunningly remodeled home at 210 Rosebay Drive, located in the charming coastal town of Encinitas. This exquisite property offers a modern and sophisticated lifestyle with no HOA restrictions, perfect for those seeking freedom and luxury. Upon entering, you'll immediately notice the spacious and inviting open floor plan, seamlessly connecting the living room and kitchen. The kitchen is a chef's dream, equipped with brand-new stainless steel appliances and ample cabinetry. Natural light floods the space creating an airy and bright atmosphere. This home features two generously sized bedrooms and a beautifully updated bathroom, each designed with contemporary fixtures and finis
A truly amazing opportunity on the west side of Lynwood Drive in Encinitas Ranch, one of the most sought after neighborhoods and streets in North County. From the entrance on you will be enamored. First, you’re greeted by a charming aviary that leads you to a chef’s dream kitchen on to an incredible backyard featuring never ending Ocean Views, a pool with spa and waterfall, a marvelous pergola with a huge fireplace, and a built-in BBQ with bar counter and seating. This lovely and spacious home flows and surprises you at every turn - 3 private ensuite bedrooms, a must have downstairs Granny Suite with its own entrance, a much appreciated separate extra downstairs room that can be
You do not want to miss this extra sweet beach house!! In the heart of all Leucadia has to offer and surrounded by multi-million dollar homes, this light and bright 1 bed/1 bath home has been remodeled with wood floors, marble countertops and stainless appliances. This home offers a very spacious outdoor deck comes with an extra storage area and is perfect for entertaining or just relaxing and enjoying the California sunshine! Walk to the beach or stroll to any of the restaurants, wineries, breweries, coffee shops, surf shops, boutiques or Farmer's Market. Perfect for a primary home or investment property as rental are allowed. No property tax or HOA fees. Space rent $2203/month.
Welcome to Neptune's Cove, your seaside oasis just a few steps to Grandview Beach. This stunning three bedroom townhome boasts expansive ocean views and luxurious amenities while living like a detached home. The modern kitchen features sleek stainless steel appliances and gorgeous Swedish hardwood flooring throughout. Cozy up next to the living room fireplace on cool evenings, or let the natural light pour in through three large skylights, creating a bright and airy atmosphere. Relax and unwind as you watch the sunset over the ocean from your private patio or the balcony off the primary suite, offering a peaceful retreat to enjoy the beauty of the coastal surroundings. The primary bathroom
Located in the highly desirable "Park Encinitas" where you own your land. This 2 bedroom, 2 bath with den/office home has an open, flowing floor plan and lots of light. Upgraded with double pane energy efficient windows and slider. Great breezes and a large entry patio. Great 55+ community with pool, spa, Club House, Social Club activities, library, kitchen, billiard room picnic area, shuffleboard, and RV parking is available, Two Pets allowed. Low $235 HOA. Convenient central location in Encinitas, a short distance to a medical complex, shopping, services, parks, and a great Senior Center. Freeways and beaches are within 3 miles. One Resident must be 55+ and others 45+ unless a D
$499,000
2 beds3 baths1,344 sq ft25.30 acres (lot)
444 N El Camino Real N Spc 61, Encinitas, CA 92024
Enjoy expansive panoramic ocean views from one of the loftiest points on Neptune Avenue in Leucadia. Nestled near California's pristine beaches and renowned surf spots, the residence is just a short walk from Beacons Beach, Moonlight Beach, and the vibrant local 101, teeming with organic cafes and gastropubs. The neighborhood exudes an eclectic charm and relaxed atmosphere. The home's interior boasts a second-story great room with high vaulted ceilings, exposed wooden beams, and a full western wall of windows. The kitchen is modernized with slate floors, bird's-eye maple cabinets, and raw edge granite countertops. The primary bedroom, occupying the home's lower west side, offers uninterrupt
Stunning coastal modern property located in the Composer District of Cardiff by the Sea. A dream home for anyone who enjoys modern living with a touch of luxury and convenience. With 4 bedrooms and 4.5 bathrooms, including a downstairs bedroom with an en-suite, it offers plenty of space for family and guests. The expansive primary suite is a true retreat, featuring a relaxing sitting area with a fireplace and a spa-like bathroom with large soaking tub and steam shower. The potential for converting the upstairs loft into a 5th bedroom adds flexibility to the layout, catering to various lifestyle needs. Chef's kitchen, complete with an oversized island, is the heart of the home. Equipped with
Custom 5 bed, 3 bath, 3,708 sqft home with a pool in West Cardiff’s highly desirable Composer District. Situated on a private and quiet tree-lined street with gorgeous blue ocean views! Live the ultimate lifestyle in one of the most sought-after neighborhoods in San Diego where you’re steps away from the world famous Seaside Market, the Coastal Rail Trail and some of the best beaches and surfing SoCal has to offer. When you’re not out and about, you’ll love unwinding by your private pool and spa or hosting guests in your own corner of paradise. This home has excellent indoor / outdoor living flow and an entertainment friendly backyard. Start your mornings taking in t
Here is the ocean view Encinitas compound you've been waiting for. Truly one-of-a-kind property with 3 permitted units, each with full kitchens, plus a pool and spa along with a detached pool house. Main property is 3 bedrooms, 2.5 baths and sit down ocean views, architecturally stunning wood beamed ceilings and tons of natural light. Downstairs is an attached 1 bedroom, 1 bath ADU as well as an another attached studio with its own bathroom, both with current long-term tenants. In addition to that, you have a detached pool house with its own bathroom, steam shower, outdoor shower and outdoor kitchen; perfect for entertaining or extra guests. This home can be used as one larger 4 bedroom hom
The second you pull up to this home, you'll be impressed. This home was taken down to the studs and completely redone. Brand new roof, windows, electrical, plumbing, sewer, insulation, HVAC, driveway, and exterior concrete flatwork and landscaping. The kitchen is so perfect that you will never want to step foot in another kitchen again. The floor-to-ceiling windows, natural landscaping, and kitchen window system promote the coveted Encinitas indoor/outdoor living. The primary bedroom and bath are incredible. The downstairs bar and entertainment area, including a wine room, are incredibly inviting. With a full-price offer, the pool(renderings), primary closet build out, and downstairs config
This area's enrollment policy is not based solely on geography. Please check the school district website for more information.
Elementary schools
Middle schools
High schools
GreatSchools Summary Rating
9/10
R. Roger Rowe Elementary School
Public, K-5
9/10
Solana Vista Elementary School
Public, K-3
9/10
Olivenhain Pioneer Elementary School
Public, K-6
9/10
El Camino Creek Elementary School
Public, K-6
8/10
La Costa Heights Elementary School
Public, K-6
Only showing 5 of
13 elementary schools.
School data is provided by GreatSchools, a nonprofit organization. Redfin recommends buyers and renters use GreatSchools information and ratings as a first step, and conduct their own investigation to determine their desired schools or school districts, including by contacting and visiting the schools themselves.Redfin does not endorse or guarantee this information. School service boundaries are intended to be used as a reference only; they may change and are not guaranteed to be accurate. To verify school enrollment eligibility, contact the school district directly.
Homes for sale in Encinitas have a median listing price of $2.35M. Some of these homes are Hot Homes, meaning they're likely to sell quickly.
What are some of the most popular neighborhoods in Encinitas?
Popular neighborhoods include Cardiff, Boca Lakes Condominiums, Rancho la Costa, Leucadia, Olivenhain, Cardiff-by-the-Sea, La Costa Oaks, and La Costa.
Encinitas, California offers various transportation options to its residents, including a well-structured public transportation system. The city is served by the North County Transit District (NCTD) which provides bus and train services, making commuting around the city convenient. For car owners, traffic levels in Encinitas can vary, but generally, peak hours may see higher congestion. Additionally, Encinitas is conveniently located near Interstate 5, providing easy access to other parts of California. Learn more on our Encinitas city guide.
What types of properties are available in Encinitas?
Encinitas, California offers a variety of single-family home types, including ranch-style homes, contemporary homes, and Mediterranean-style homes, among others. These homes can be found throughout the city, with some neighborhoods featuring a higher concentration of specific styles. Most properties in Encinitas, California offer three to five bedrooms and were built within the past few decades. To explore different property types for sale in Encinitas, California, use the 'Home type' filter located above the active listings. Customize your search by selecting options like single-family homes, condos, townhomes, and more.
What is life like in Encinitas?
Encinitas, California offers a vibrant and laid-back lifestyle with a diverse range of activities to enjoy. The landscape is characterized by stunning coastal views, rolling hills, and lush greenery. The weather is generally mild and enjoyable, with warm summers and mild winters. The job market in Encinitas provides a variety of opportunities across different industries, including technology, healthcare, and hospitality. Residents can engage in a plethora of recreational activities such as surfing, hiking, biking, and exploring local parks and trails.
What are the schools and amenities like in Encinitas?
Encinitas, California offers a variety of public amenities to its residents. The city boasts a number of restaurants, offering a diverse range of cuisines to cater to different tastes. For outdoor enthusiasts, there are numerous parks available for recreation and relaxation. Grocery stores are conveniently located throughout the city, making shopping for daily necessities easy and convenient. In addition, Encinitas also provides other amenities such as libraries, fitness centers, and more to cater to the diverse needs of its residents.
In the past month, 41 homes have been sold in Encinitas. In addition to houses in Encinitas, there were also 20 condos, 17 townhouses, and 4 multi-family units for sale in Encinitas last month. Encinitas is a minimally walkable city in San Diego County with a Walk Score of 43. Encinitas is home to approximately 59,606 people and 23,161 jobs. Find your dream home in Encinitas using the tools above. Use filters to narrow your search by price, square feet, beds, and baths to find homes that fit your criteria. Our top-rated real estate agents in Encinitas are local experts and are ready to answer your questions about properties, neighborhoods, schools, and the newest listings for sale in Encinitas. Our Encinitas real estate stats and trends will give you more information about home buying and selling trends in Encinitas. If you're looking to sell your home in the Encinitas area, our listing agents can help you get the best price. Redfin is redefining real estate and the home buying process in Encinitas with industry-leading technology, full-service agents, and lower fees that provide a better value for Redfin buyers and sellers.


 REDFIN IS COMMITTED TO AND ABIDES BY THE FAIR HOUSING ACT AND EQUAL OPPORTUNITY ACT. READ REDFIN'S FAIR HOUSING POLICY AND THE NEW YORK STATE FAIR HOUSING NOTICE.
 United States
 Canada