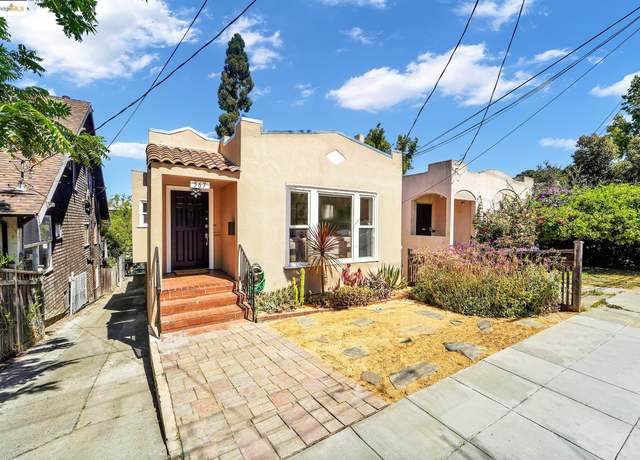
 567 Vernon St, Oakland, CA 94610
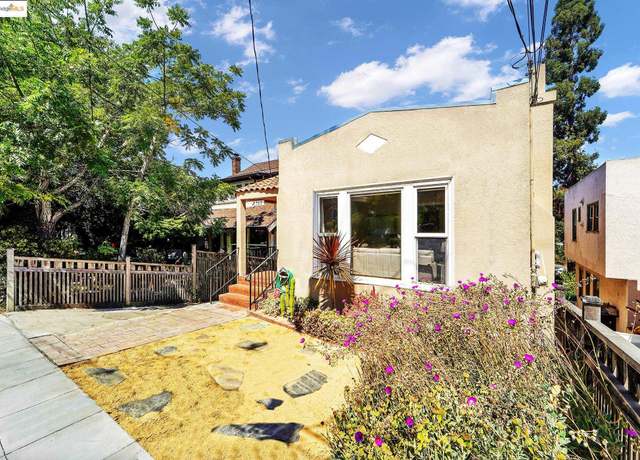 567 Vernon St, Oakland, CA 94610
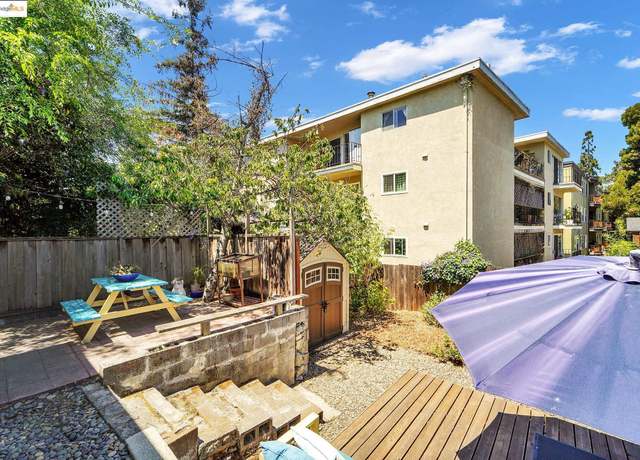 567 Vernon St, Oakland, CA 94610
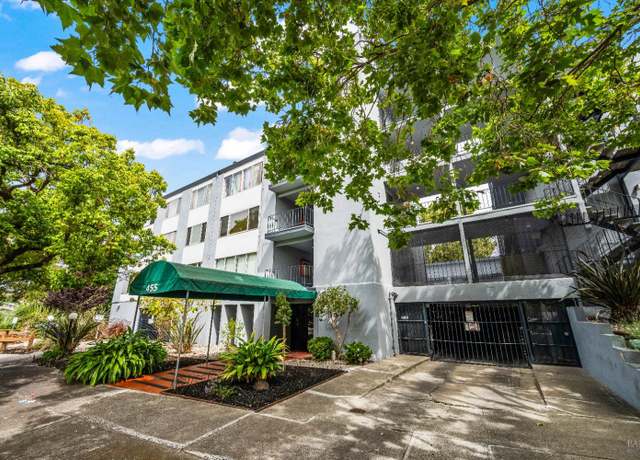 455 Crescent St #206, Oakland, CA 94610
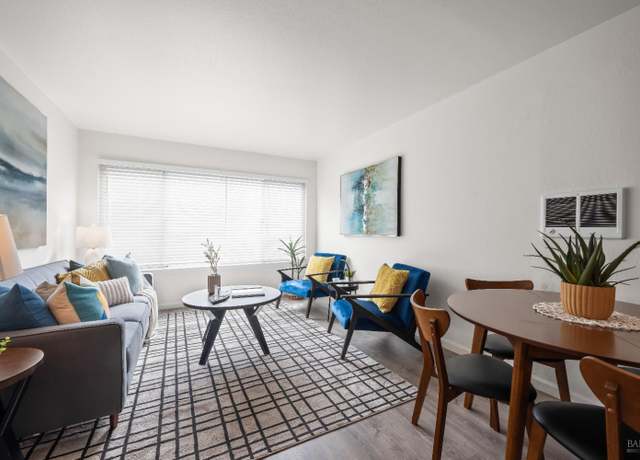 455 Crescent St #206, Oakland, CA 94610
 455 Crescent St #206, Oakland, CA 94610
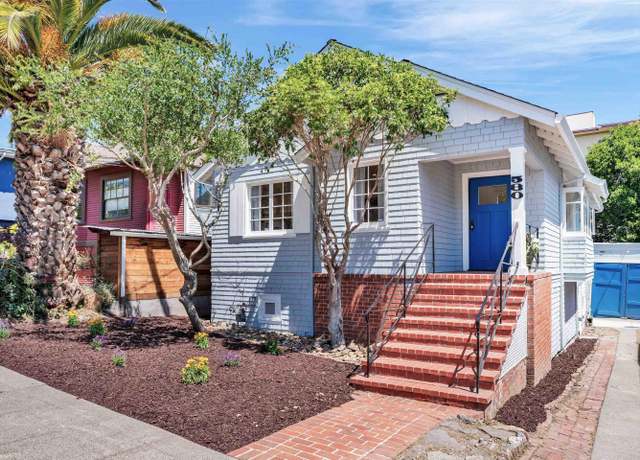 580 Chetwood St, Oakland, CA 94610
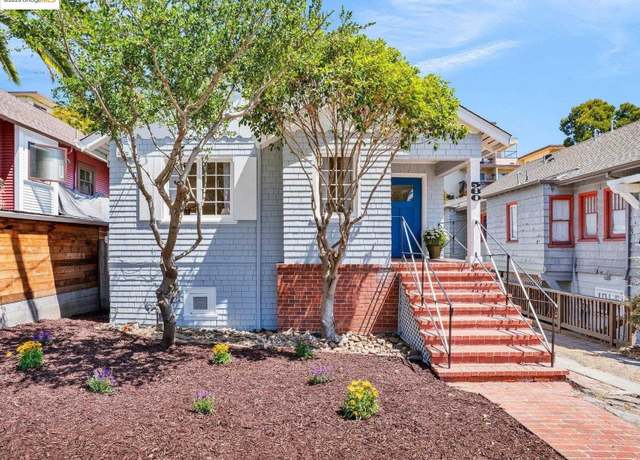 580 Chetwood St, Oakland, CA 94610
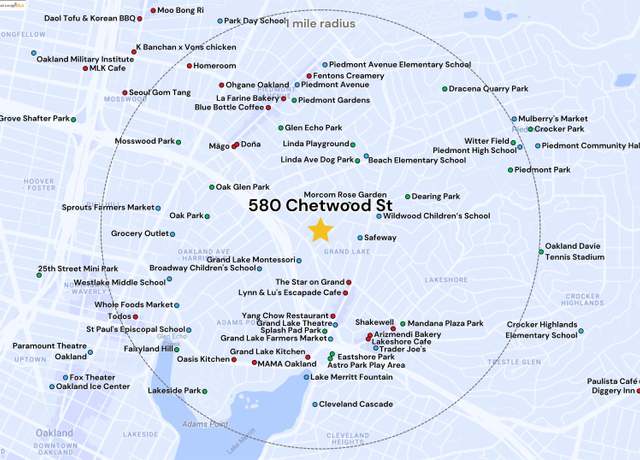 580 Chetwood St, Oakland, CA 94610
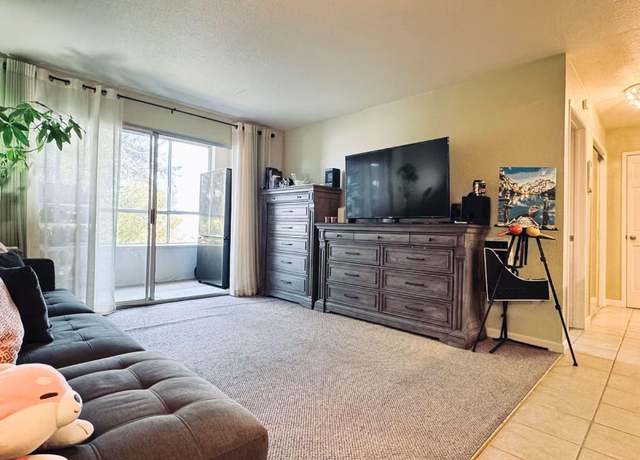 466 Crescent St #224, Oakland, CA 94610
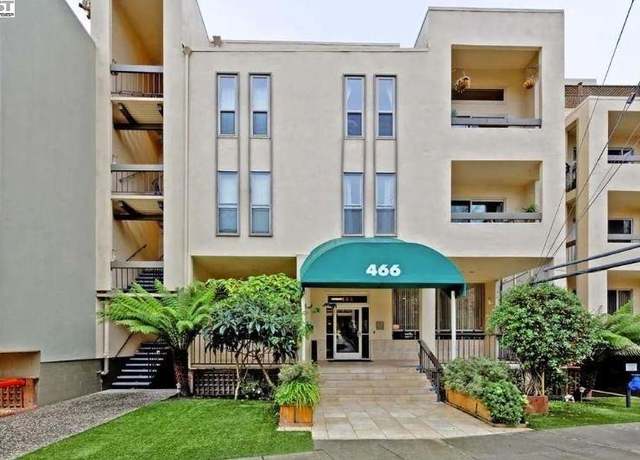 466 Crescent St #224, Oakland, CA 94610
 466 Crescent St #224, Oakland, CA 94610
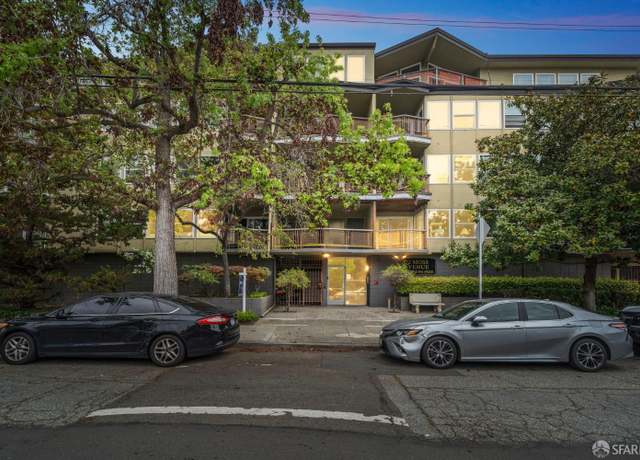 22 Moss Ave #109, Oakland, CA 94610
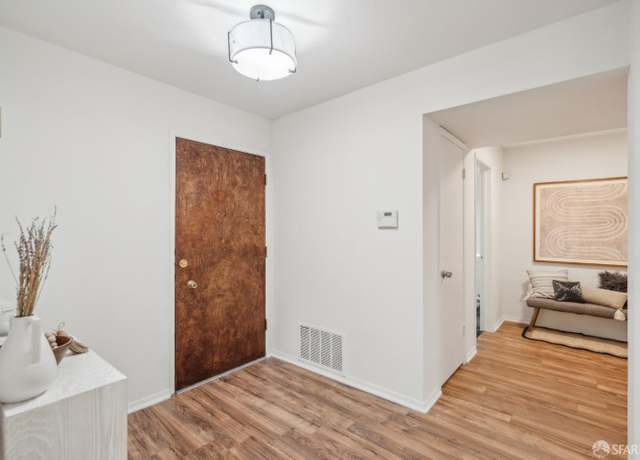 22 Moss Ave #109, Oakland, CA 94610
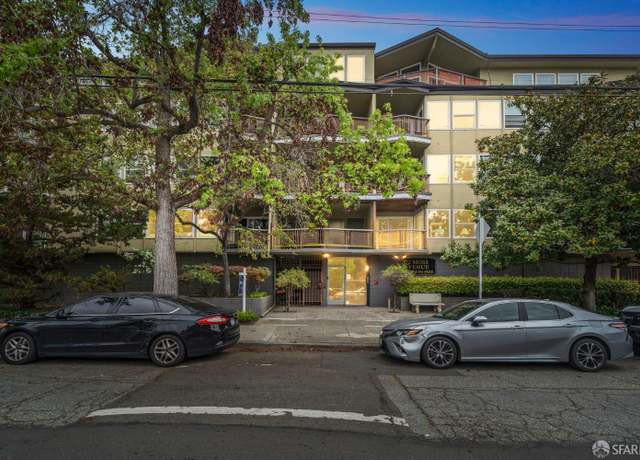 22 Moss Ave #109, Oakland, CA 94610
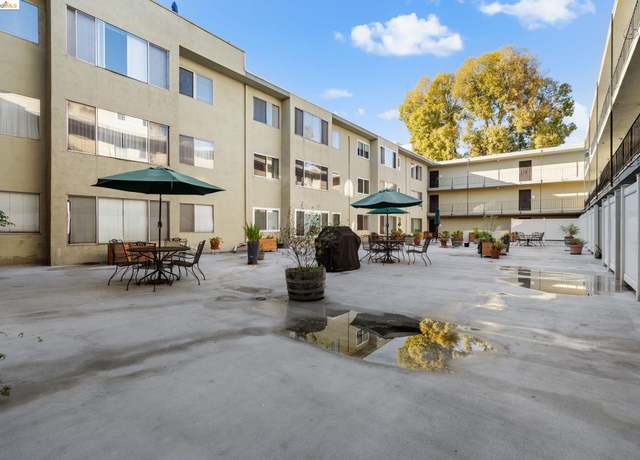 455 Crescent St #220, Oakland, CA 94610
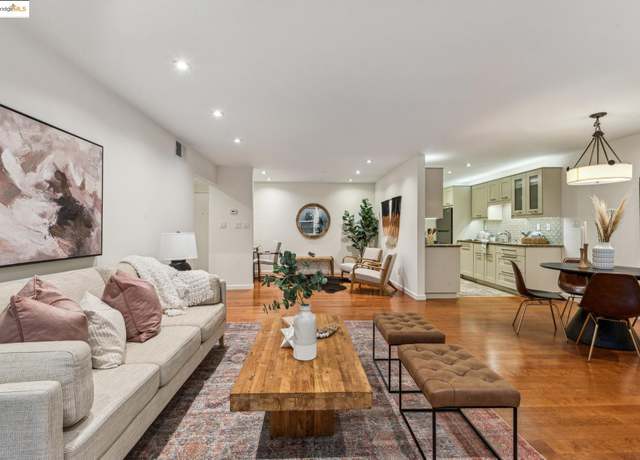 22 Moss Ave #107, Oakland, CA 94610
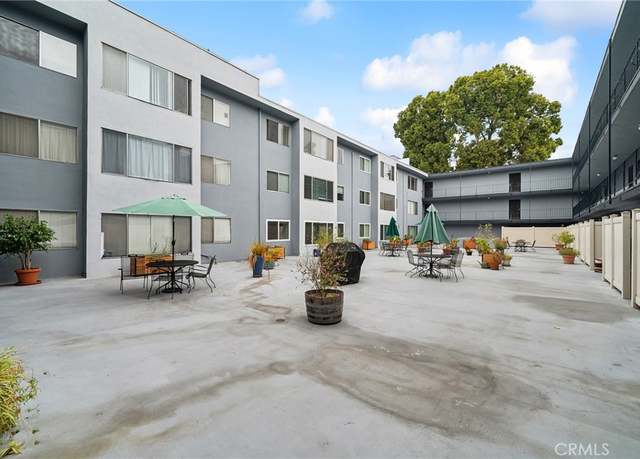 455 Crescent St #313, Oakland, CA 94610
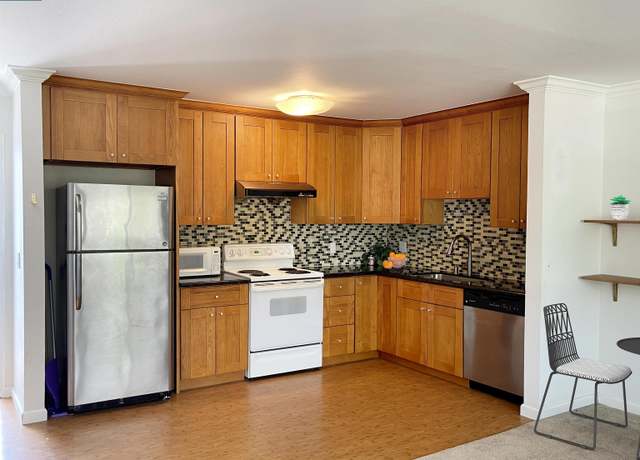 455 Crescent St #315, Oakland, CA 94610
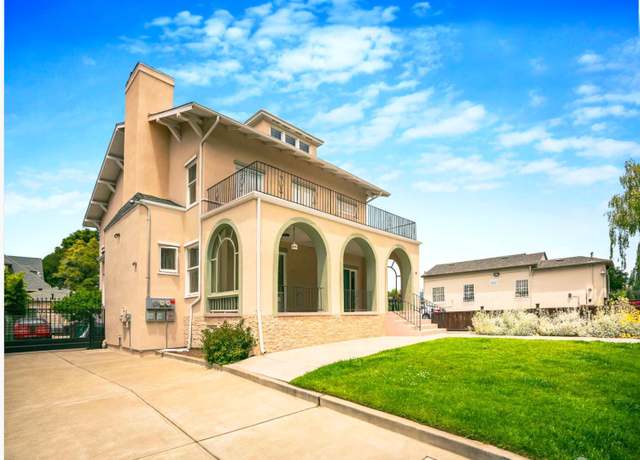 433-435 Vernon St, Oakland, CA 94610
 433-435 Vernon St, Oakland, CA 94610
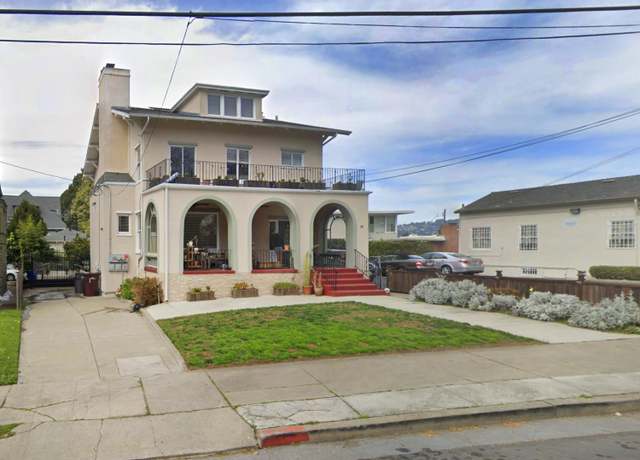 433-435 Vernon St, Oakland, CA 94610
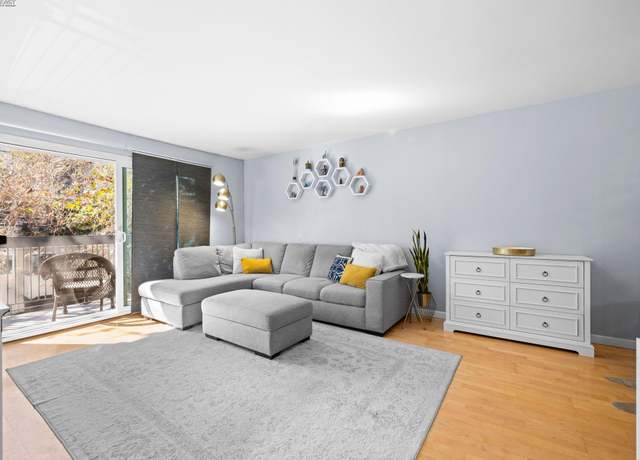 150 Pearl St #106, Oakland, CA 94611
 150 Pearl St #106, Oakland, CA 94611
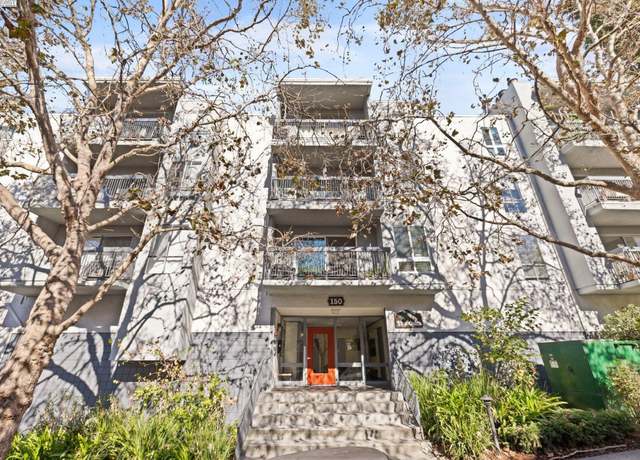 150 Pearl St #106, Oakland, CA 94611
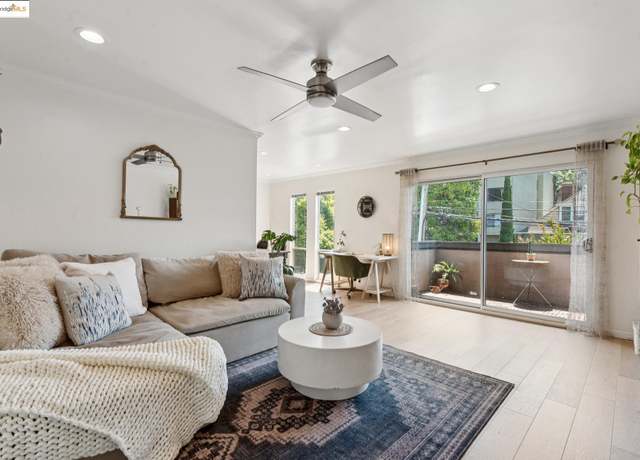 407 Orange St #410, Oakland, CA 94610
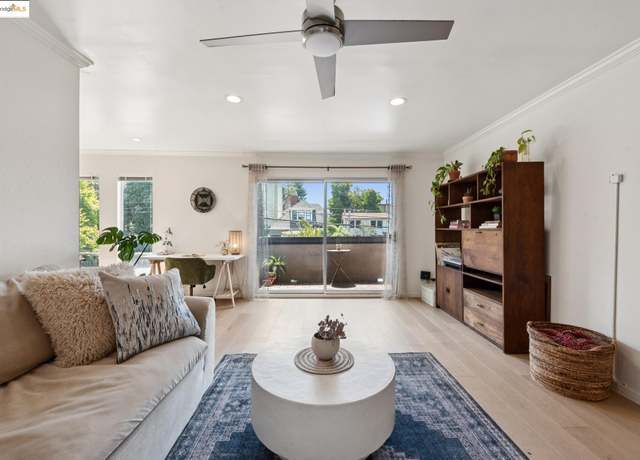 407 Orange St #410, Oakland, CA 94610
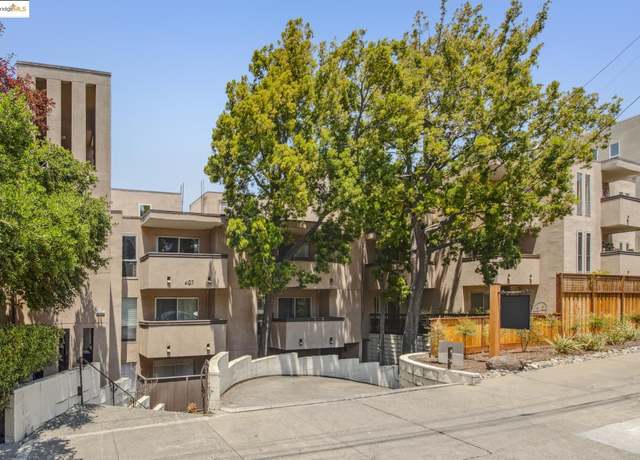 407 Orange St #410, Oakland, CA 94610
 389 Belmont St #306, Oakland, CA 94610
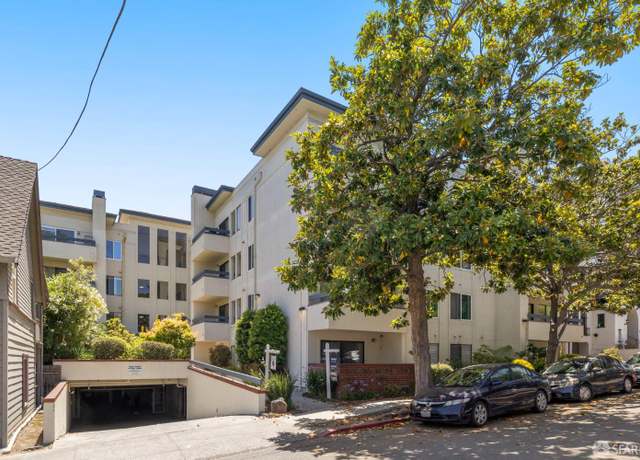 389 Belmont St #306, Oakland, CA 94610
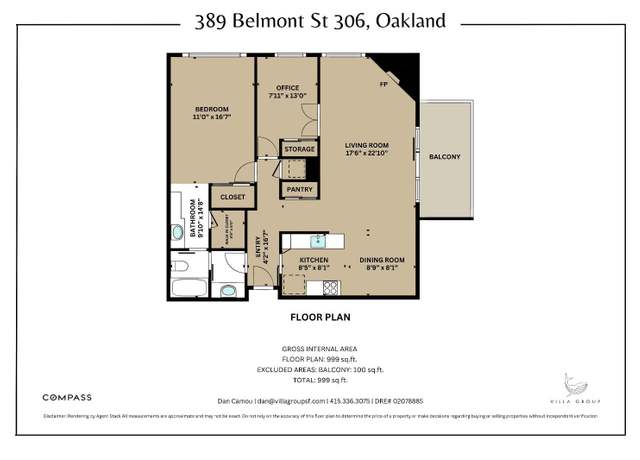 389 Belmont St #306, Oakland, CA 94610
 323 Monte Vista Ave #103, Oakland, CA 94611
 323 Monte Vista Ave #103, Oakland, CA 94611
 323 Monte Vista Ave #103, Oakland, CA 94611
 360 Vernon St Apt 205, Oakland, CA 94610
 360 Vernon St Apt 205, Oakland, CA 94610
 360 Vernon St Apt 205, Oakland, CA 94610
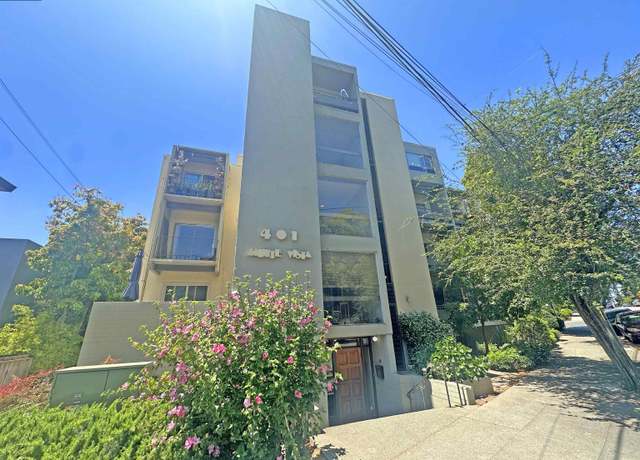 401 Monte Vista Ave #103, Oakland, CA 94611
 425 Orange St #210, Oakland, CA 94610
 375 Jayne Ave #106, Oakland, CA 94610
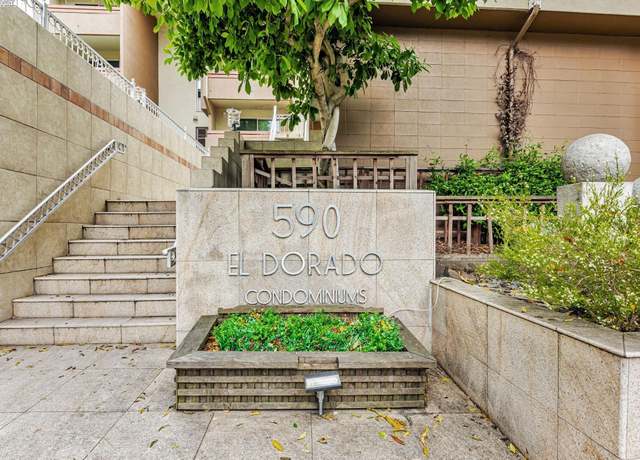 590 El Dorado Ave #208, Oakland, CA 94611
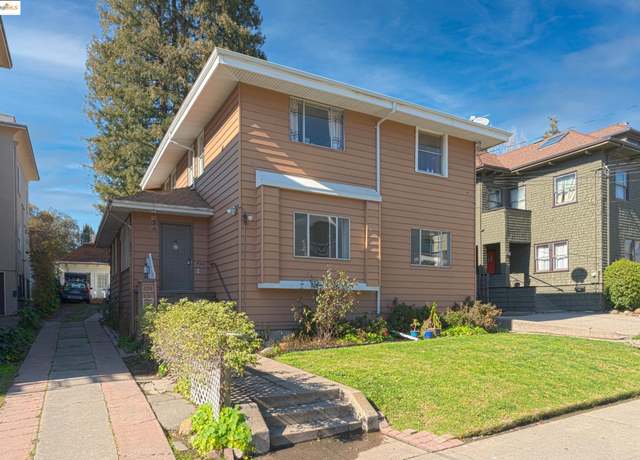 429 Euclid Ave, Oakland, CA 94610
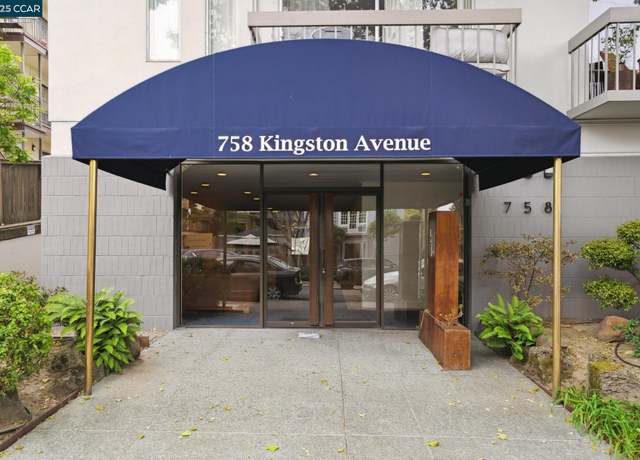 758 Kingston Ave #25, Oakland, CA 94611
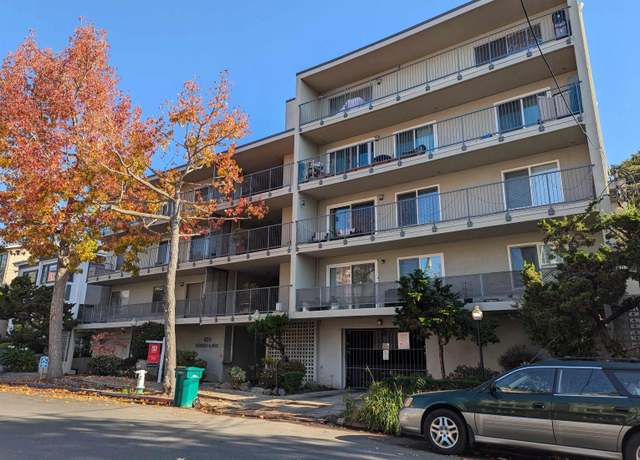 424 Staten Ave #308, Oakland, CA 94610
 323 Monte Vista Ave #107, Oakland, CA 94611
 425 Orange St #212, Oakland, CA 94610
 360 Vernon St #304, Oakland, CA 94610
 94 Bayo Vista Ave #304, Oakland, CA 94611
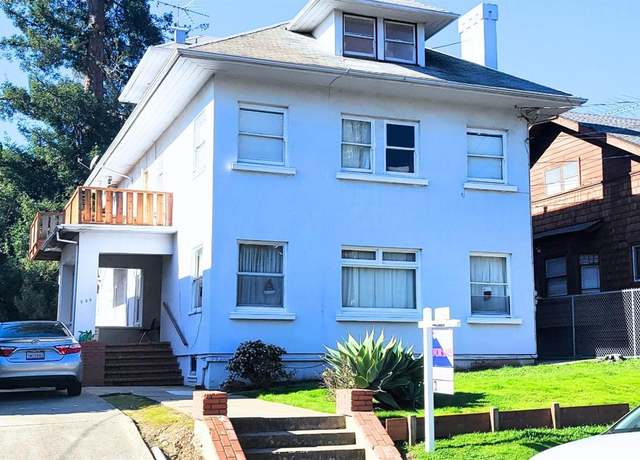 389 Euclid Ave, Oakland, CA 94610
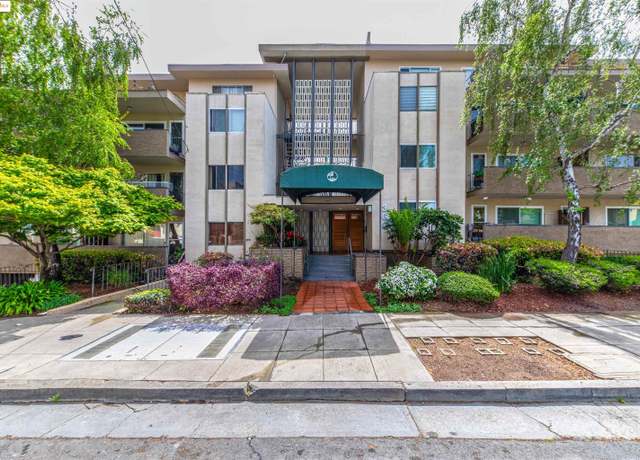 360 Vernon St #209, Oakland, CA 94610
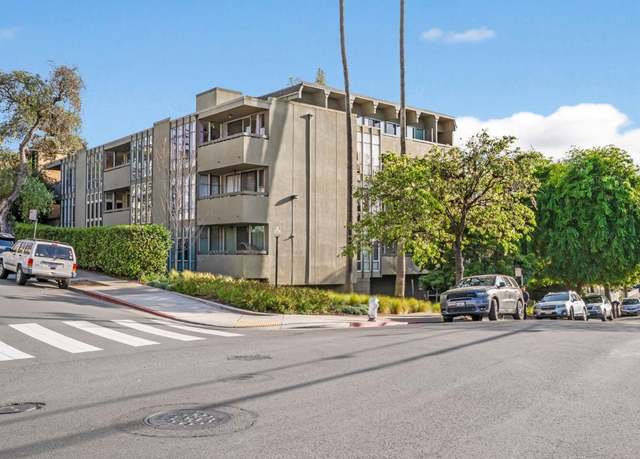 398 Adams St #302, Oakland, CA 94610
- Median Sale Price
- # of Homes Sold
- Median Days on Market
Median Sale Price (All Home Types)
$529,500
-29.0% YoY | Jun 2025
- 1 year
- 3 year
- 5 year
Loading...
About us
Find us
Subsidiaries
Copyright: © 2025 Redfin. All rights reserved.
Updated January 2023: By searching, you agree to the Terms of Use, and Privacy Policy.
Do not sell or share my personal information.
REDFIN and all REDFIN variants, TITLE FORWARD, WALK SCORE, and the R logos, are trademarks of Redfin Corporation, registered or pending in the USPTO.
California DRE #01521930
Redfin is licensed to do business in New York as Redfin Real Estate. NY Standard Operating Procedures
New Mexico Real Estate Licenses
TREC: Info About Brokerage Services, Consumer Protection Notice
Rocket Mortgage is an affiliated business of Redfin. All mortgage lending products and information are provided by Rocket Mortgage, LLC | NMLS #3030; www.NMLSConsumerAccess.org. Licensed in 50 states. This site is not authorized by the New York State Department of Financial Services for mortgage solicitation or loan applications activities related to properties located in the State of New York. For additional information on Rocket Mortgage or to receive lending services in the State of New York, please visit RocketMortgage.com.
Rocket Mortgage, LLC, Rocket Homes Real Estate LLC, Rocket Card, LLC, RockLoans Marketplace LLC (doing business as Rocket Loans), and Rocket Money, Inc., are separate operating subsidiaries of Rocket Limited Partnership. Redfin Corporation is an affiliated business of Rocket Limited Partnership. Each company is a separate legal entity operated and managed through its own management and governance structure. Rocket Limited Partnership is an indirect, wholly owned subsidiary of Rocket Companies, Inc. (NYSE: RKT).
If you are using a screen reader, or having trouble reading this website, please call Redfin Customer Support for help at 1-844-759-7732.
 REDFIN IS COMMITTED TO AND ABIDES BY THE FAIR HOUSING ACT AND EQUAL OPPORTUNITY ACT. READ REDFIN'S FAIR HOUSING POLICY AND THE NEW YORK STATE FAIR HOUSING NOTICE.
 United States
 Canada