17 housing trends that defined the year, including record home prices and sky-high mortgage rates
The 2022 housing market was nothing short of remarkable. The pandemic and resulting remote work continued to define how, when, and where people bought homes. The median U.S. home price hit a record high before falling slightly. Rising rents stretched renters’ budgets. High inflation put increased pressure on almost everyone. For the first time in history, mortgage rates doubled in the span of just one year. The list goes on.
In general, 2022 was a reaction to the dramatic real estate boom in 2021. The year started with a surge in prices and growth across the board before falling alongside record inflation in the fall. November and December saw a much slower and seasonally-expected housing market, with year-over-year changes in rent prices, house prices, and interest rates either falling or slowing down.
Below is a non-exhaustive list of data points and visuals that defined the 2022 housing market.
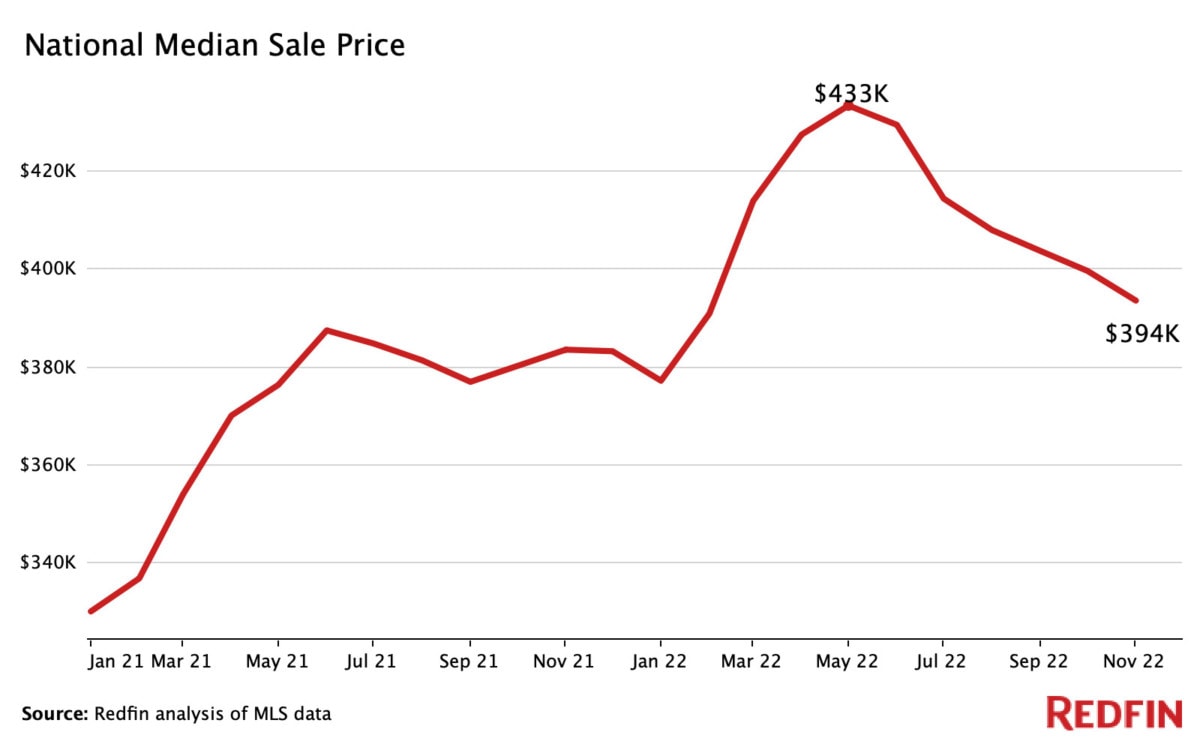
1. Home prices rose to an all-time high
In May, the typical home sold for $430,365, a record high since records began in 1963, shattering 2021’s high of $386,000. In March, the median sale price rose 16.8% year over year, the largest percentage increase over the last five years. Following the pandemic, demand skyrocketed while supply remained historically low, causing a severe housing shortage and price boom that continued throughout 2021 and peaked midway through 2022. In April and May, mortgage rates rose to combat rising inflation, which began reversing housing trends from earlier in the year.
Despite a quickly cooling housing market, prices are still higher today than any previous year on record.
2. San Francisco was the most expensive metro area for homebuyers in 2022
The median sale price of a home in San Francisco was $1,505,000 in 2022, up 0.3% year over year. For one week in April, the median price reached a high of $1,700,000, just below 2021’s all-time high of $1,728,000. As the year went on, prices dropped closer to pre-pandemic levels, which will likely continue until mortgage rates fall further.
- Six of the top ten most expensive metros were in California.
- Many Florida metros experienced the largest year-over-year price growth, including Tampa (18%), Orlando (14.9%), Jacksonville (14.7%), and Miami (14.2%).
- Tampa had the largest year-over-year price growth of all large metros in the country.
The top ten most expensive cities to buy a home in 2022
City |
Median sale price |
Year-over-year change |
| $1,505,000 |
+0.3% |
|
| $1,435,000 |
+7.2% |
|
| $970,000 |
+10.4% |
|
| $939,000 |
+4.2% |
|
| $850,000 |
+7.0% |
|
| San Diego, CA | $815,000 |
+10.3% |
| $777,000 |
+9.3% |
|
| $683,000 |
+5.5% |
|
| $650,000 |
+7.7% |
|
| $600,000 |
+5.8% |
Data includes the yearly aggregated median sale prices out of all homes sold in each of the 50 largest metropolitan areas. Data does not take into account local median incomes and home affordability.
3. Detroit was the least expensive metro area for homebuyers in 2022
The median sale price for a home in Detroit was $165,000 in 2022, up 3.3% year over year. Home prices in Detroit hit $213,000 for a week in June, making it the most expensive month of the year but still nearly 50% lower than the national median. In general, year-over-year price increases in 2022 were smaller across most major metros than in 2021, and growth dipped further heading into the first week of December.
- The top ten least expensive metros were all located in the Rust Belt, a geographic region near the Great Lakes.
- Philadelphia was the only large metro that experienced a price decrease in 2022.
- Kansas City, MO was the eleventh least expensive metro, and the first non-Rust-Belt metro on the list.
The top ten least expensive cities to buy a home in 2022
City |
Median sale price |
Year-over-year change |
| $165,000 |
+3.3% |
|
| $185,000 |
+5.4% |
|
| $205,000 |
+2.4% |
|
| $235,000 |
+9.6% |
|
| $239,000 |
+7.7% |
|
| $249,900 |
-0.01% |
|
| $260,000 |
+4.8% |
|
| $262,000 |
+4.5% |
|
| $275,000 |
+11.6% |
|
| $290,000 |
+10.3% |
Data includes the yearly aggregated median sale prices out of all homes sold in each of the 50 largest metropolitan areas. Data does not take into account local median incomes and home affordability.
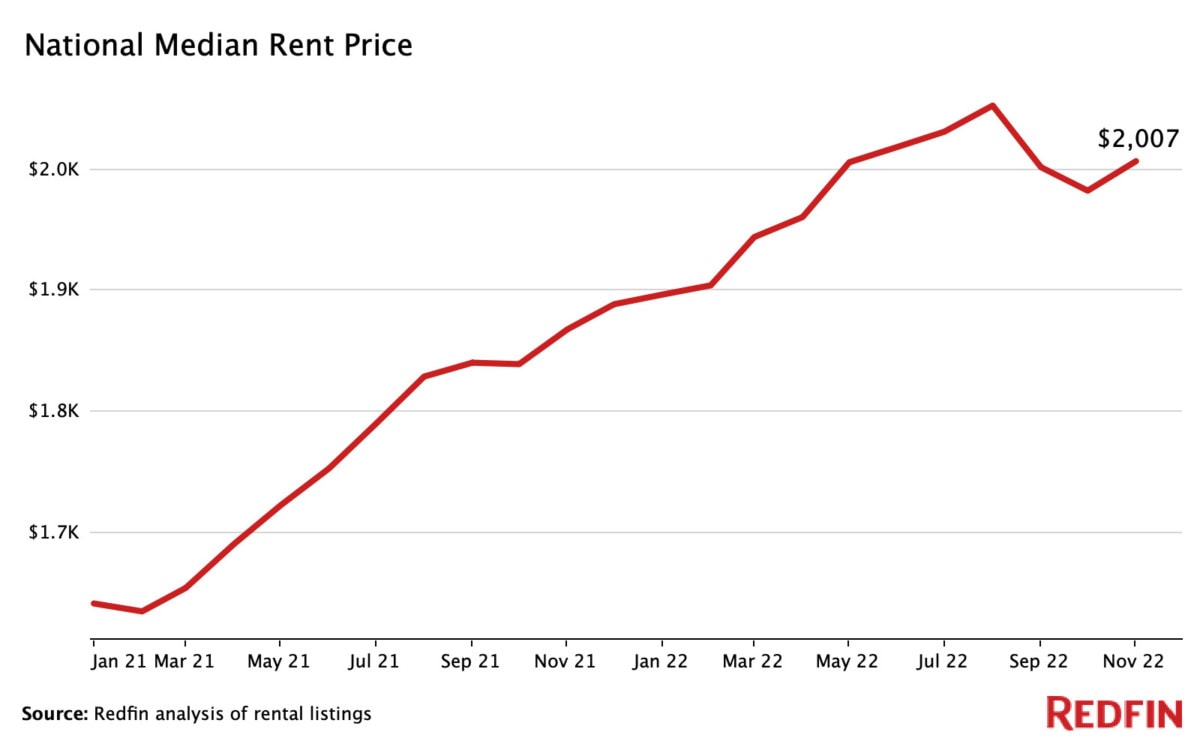
4. Rent prices rose dramatically as supply struggled to keep up with demand
Rent prices in 2022 were 12.8% higher than they were in 2021. Nationwide, the median rent price rose to $2,053 in August before dipping slightly, the highest on record and a 12.3% increase year-over-year. Following the pandemic, rent prices skyrocketed largely because of a lack of supply and a boom in demand, both of which are just now balancing out.
- Median rent prices in New York rose to over $4,000, retaining its dominance as the most expensive metro for renters in the country.
- Many of the least expensive metros experienced the highest year-over-year rent increases, including Oklahoma City (23.3%), Cincinnati (17.6%), and Pittsburgh (14.8%).
- Oklahoma City experienced the highest year-over-year rent increases in the country.
- Rent growth has consistently outpaced wages for decades, but the most recent data states that a staggering 40% of renters spent more than 30% of their income on rent from 2017-2021.
There are currently over 1.1 million rental units under construction in the U.S., which will come available for rent over the next year, helping to alleviate part of the housing shortage.
“We expect rents to fall in nearly every part of the country by the middle of 2023 as supply starts overtaking demand,” notes Taylor Marr, Redfin Deputy Chief Economist. “While renters typically get the best deal during the winter months as demand is lower, rents are continuing to ease. Because of this, there won’t be as much of a seasonal increase come spring, and thus patience for a good deal will pay off. And don’t be afraid to negotiate; some landlords may be open to concessions like a free month’s rent or free parking.”
The top ten most expensive cities for renters in 2022
City |
Median rent price |
Year-over-year change |
| $4,043 |
+10.8% |
|
| $3,764 |
+3.1% |
|
| $3,749 |
+7.6% |
|
| $3,558 |
+7.3% |
|
| $3,435 |
+0.8% |
|
| $3,345 |
+8.2% |
|
| $3,098 |
+8.7% |
|
| $2,994 |
+7.0% |
|
| $2,749 |
+6.7% |
|
| $2,700 |
+4.6% |
The top ten least expensive cities for renters in 2022
City |
Median rent price |
Year-over-year change |
| $1,308 | +23.3% | |
| $1,372 |
+13.2% |
|
| $1,442 |
+12.4% |
|
| $1,447 |
+4.7% |
|
| $1,454 |
+13.9% |
|
| $1,456 |
+3.1% |
|
| $1,547 |
+4.8% |
|
| $1,555 |
+9.7% |
|
| $1,571 |
+4.8% |
|
| Memphis, TN | $1,581 |
+9.5% |
Data includes the 2022 aggregated median rent prices for each of the 50 largest metropolitan areas compared to 2021 data from the same period. Data is the median of all 0-3 bedroom rental homes.
5. Homebuyers looking to relocate favored Sun-Belt cities
24.1% of homebuyers looked to move to a different metro during the three months ending in November. This is on par with the record high of 24.2% in the third quarter and up from 19.1% in 2019.
- Homebuyers looked to move to sunny, relatively affordable areas, with Miami, Tampa, Las Vegas, and Phoenix being the most popular destinations.
- Homebuyers looked to move away from expensive coastal metros like San Francisco, Los Angeles, and New York, which topped the list.
- 100% of homes in many popular relocation metros experienced severe drought in the past year, including Phoenix, Las Vegas, and Sacramento.
“Similar to 2021, continued growth in remote work and a desire for housing affordability drove relocation patterns in 2022,” Marr continues. “However, trends in some popular destinations reversed course after they became too popular, competitive, and expensive. Cities like Salt Lake City, Phoenix, Tucson, Dallas, and San Antonio all declined in popularity in 2022.”
Data is the percent of Redfin.com users searching for homes outside their metro. Data is the year median aggregate of multiple three month moving aggregates and does not include September-December. Keep up with the latest migration news here.
6. Inflation rose at a record pace, affecting every facet of the housing market
The prices of goods and services rose to 6.48% year over year in November, the highest percentage since August 1982 and more than double the rate from November 2021. In fact, inflation rates have doubled compared to the previous year in every month since June. Rising prices severely limited consumer spending and slowed nearly every facet of the housing market.
-
- To combat the historic inflation, the Fed raised its target interest rate to 4.5%, the highest in 15 years.
- Skyrocketing interest rates caused mortgage rates to rise and increased fears of a recession, keeping homebuyers out of the housing market.
- Inflation rose the fastest in pandemic boomtowns due partly to the sudden jump in house prices, which is a key contributor to inflation.
Data courtesy of FRED. Data measures core CPI (less food and energy) through November 2022.
7. Mortgage rates ballooned to nearly 7% in response to record inflation
After decades of falling mortgage rates, in 2022, rates climbed to nearly 7% in both October and November, higher than any point since 2002. In fact, from October 2021 to October 2022, mortgage rates doubled in one year for the first time in history.
As the year came to a close, optimistic inflation data helped reduce housing interest rates to below 7%.
- In popular migration metros like Phoenix, Las Vegas, and Austin, higher mortgage rates and expensive home prices hurt buyers the most.
- In Phoenix, for example, as mortgage rates climbed in May and June, only 21.5% of homes were affordable to buyers with a $2,500 monthly mortgage budget – a 28.5% drop from 2021.
High inflation and rising mortgage rates often deter buyers, but if you’re able to afford it, ownership may be the better option. “Homeownership is a long-term investment that can lead to significant net worth gains, even with rates above 6%,” advises Dean Hayes, Area Sales Manager with Bay Equity, a Redfin company. “Mortgage rates will likely go down in the new year, meaning more home buyers will return to the market, creating increased competition and less room for negotiation.”

8. Housing inventory rose after hitting a record low
10.7 million homes were listed for sale through November, up 11.2% compared to the 9.5 million homes listed through November in 2021. In the three months ending November 2022, the number of homes for sale increased by 15% year over year, the biggest increase on record.
As mortgage rates rose alongside inflation, more buyers decided to stay put, allowing inventory to increase. Since December 2019, inventory has declined year over year until it finally rose in June 2022.
“Buyers have more leverage now than they have since 2010,” advises San Francisco Redfin agent Josh Felder. “Even with higher mortgage rates, if you intend to stay put for longer than five years, it’s a great investment. Homes are forecast to still appreciate, even in light of current circumstances. Sellers should understand that the market is still moving. Homes don’t sell in five days, well over list price, anymore.”
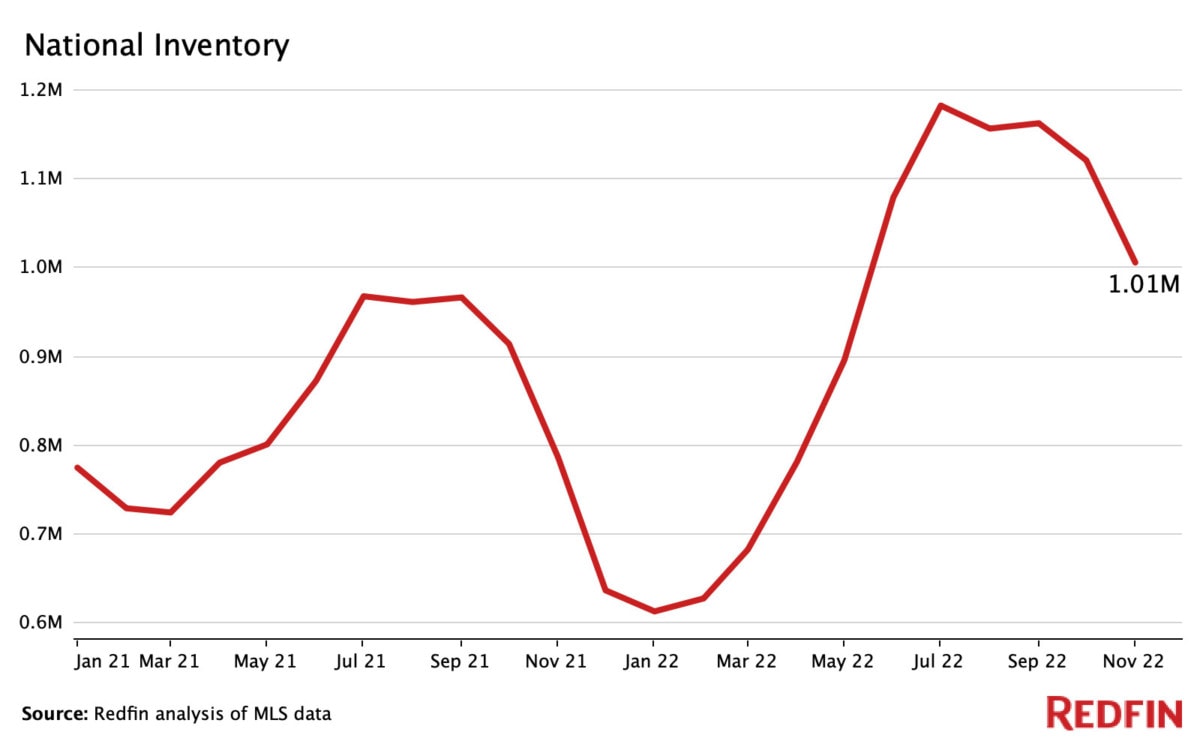
Inventory and supply are calculated in rolling 90-day periods, e.g., January 2022 data is the three-month period from November 1, 2021, through January 31, 2022.
9. Months of supply dropped to a near-record low of just 1.2 months
While inventory measures the number of homes currently available for sale, months of supply measures the amount of time it would take those homes to sell. Four to five months of housing supply is considered the optimal benchmark. Less than three months of housing supply often means that there are more buyers than sellers, while a higher number means there are more sellers than buyers. Inventory and supply typically move together.
Nationwide, months of housing supply dipped to just over 1.2 months in March before slowly rebounding in the summer. Year over year, months of supply has declined almost every month since January 2020.
- As buyers retreated due to high inflation and interest rates, months of supply began to grow in July and August, reaching 2.3 months of supply by September.
- In Seattle, months of supply reached a near-record low of just 15.5 days in January and February, the lowest of any major metropolitan area.
“We are quickly working back toward a balanced market, which is three to six months of inventory,” says Seattle-area Redfin agent Brian Shields. “We’ve been in a seller’s market with less than five months of inventory for several years, until midway through this year. Buyers now have a lot more choices than they did last Spring.”
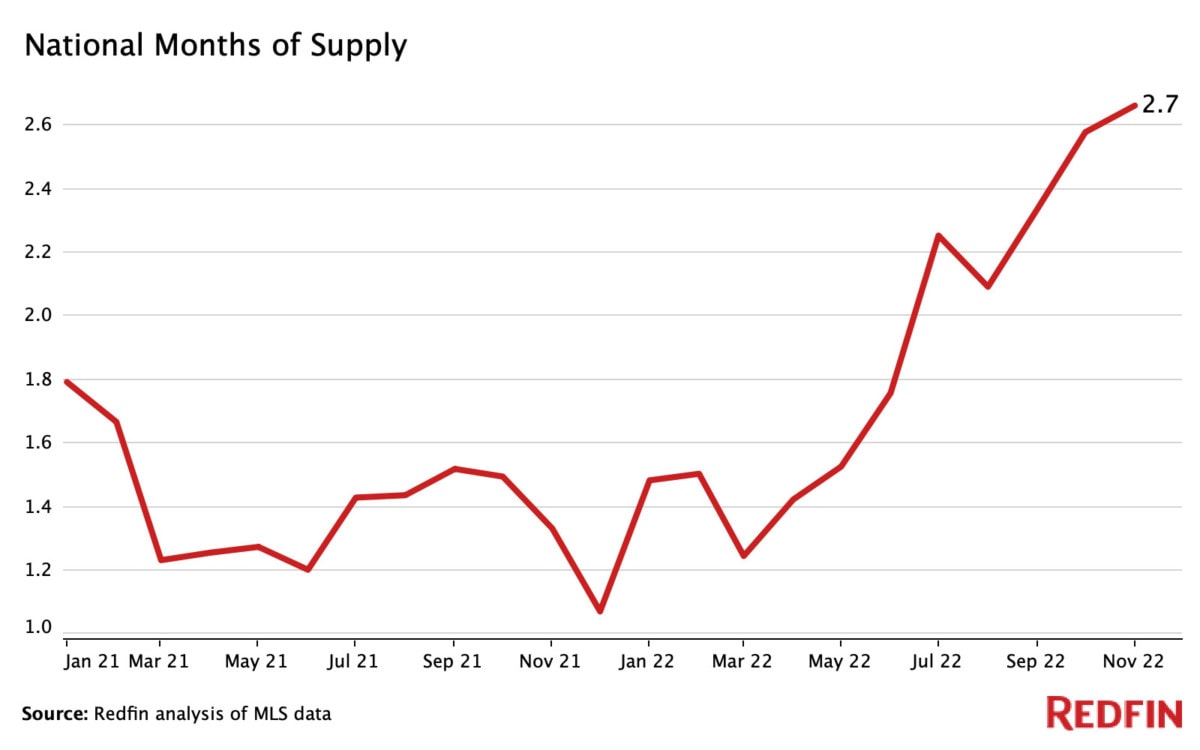
Inventory and supply are calculated in 90-day periods, e.g., January 2022 data is the three-month period from November 1, 2021, through January 31, 2022.
10. New construction took up a growing share of housing inventory
There were 1.25 million privately-owned new homes built in the U.S. through November 2022, up 3% from a year ago. As inflation rose and the market slowed, builders began slowing their production to sell off what they already had.
New construction has been taking up a growing portion of overall housing supply since 2011, when building rebounded after the financial crisis. This trend intensified in 2021 and only recently began to slow down. “If you’re a buyer, consider new construction homes,” advises Kim Stearns, a Northern Idaho Redfin agent. “Because of an inventory buildup, many builders have one to four homes they would love to close on and will often offer incentives.”
- Over 63% of new builds were single-family homes, up 2% year over year
- New construction starts dropped from their peak of 164,000 in April to 111,000 in November
Data courtesy of Census.gov.
11. Home sales fell nearly 17% year over year
5.62 million U.S. homes sold through November, down 16.6% year over year, a sharp decrease from the 6.74 million sold in 2021 during the same period. In general, between four and seven million homes sell per year, with the historical average sitting at just over 5 million. Year-over-year home sales decreased in every month of 2022, with October and November posting the sharpest declines.
- Just 376,000 homes sold in November, down 37.4% year over year and a seasonally-adjusted historic low (since 2001).
- June was the busiest month with 626,641 homes sold, a 15.2% year-over-year dip.
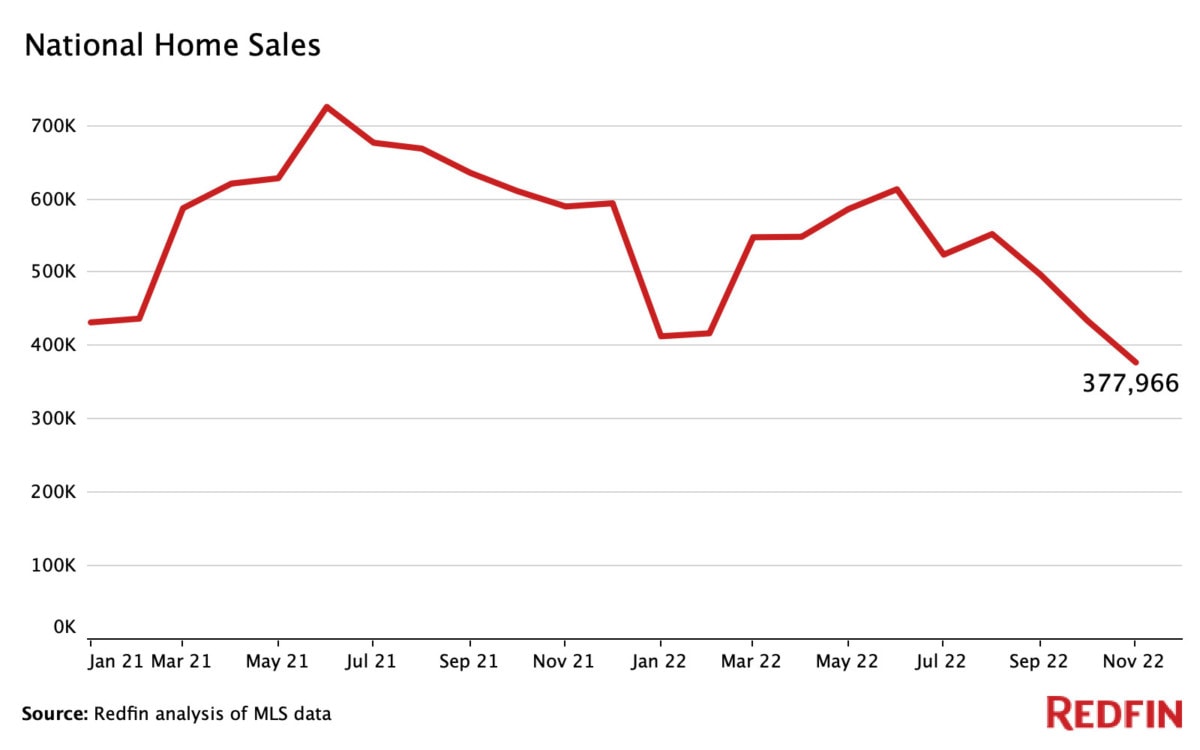
Data was collected through November.
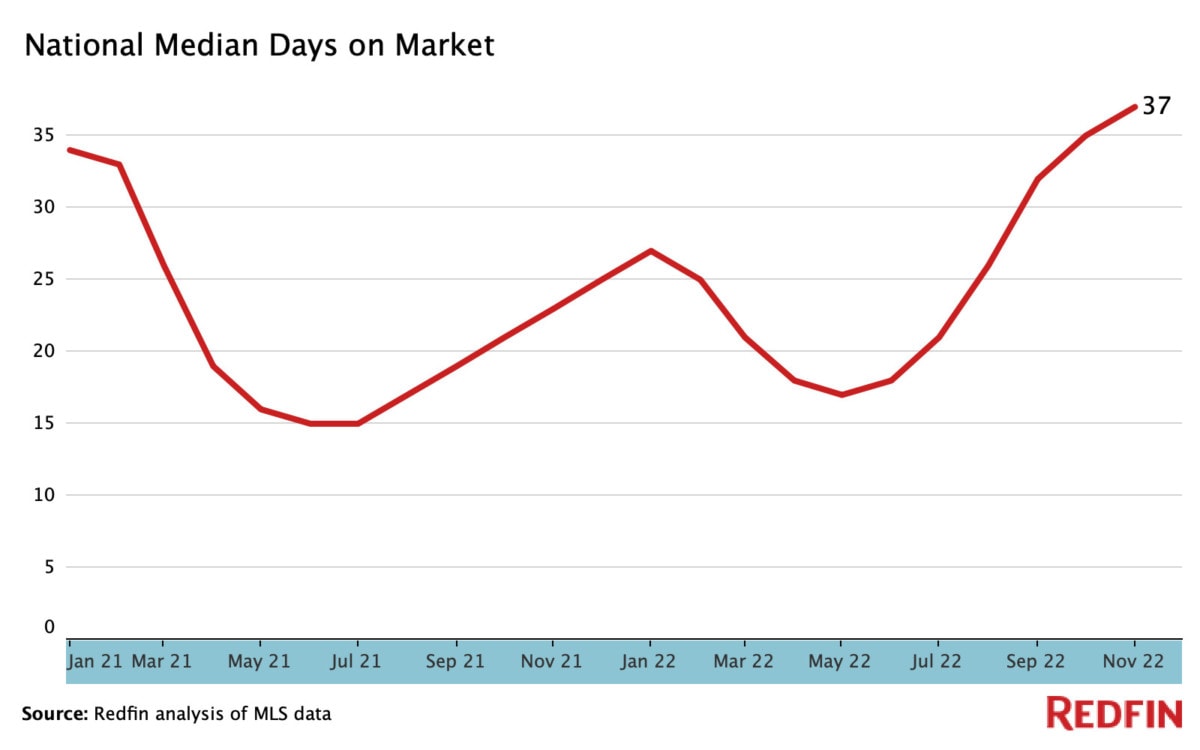
12. Median days on market rose at a record pace, signaling a dramatic turnaround from 2021’s breakneck pace
In 2022, homes spent an average of just 24 days on the market, an 8.4% increase year over year compared to the 22 days on the market in 2021. Since 2020, a housing supply crunch has been caused by supply chain issues, a chronic lack of homebuilding, and an increase in demand. In 2022, time on the market ticked up as homebuilding began to catch up to demand and high mortgage and inflation rates limited buyers’ spending power.
“Due to a slowing economy and layoffs in the tech sector near the end of the year, many buyers paused their home search due to affordability and job security,” notes Frank Vettese III, a San Francisco Redfin agent. “This was one of many factors that contributed to the dramatic slowdown in sales.”
- May was the busiest month of the year, with homes spending an average of just 17 days on the market.
- In the four weeks ending December 4th, homes spent an average of 37 days on the market, the slowest month of 2022 and the biggest year-over-year slowdown on record.
13. 14% of active home listings experienced price drops
On average, 14% of active homes for sale had price drops in 2022, up 4.7% year over year. In October, 22.6% of listings had price drops, a decades-long high. In fact, from February through July, the number of homes with price drops rose from 5.7% to 19.5%, a record-fast increase. “The shift was dramatic,” says Christy Beach, a Seattle-area Redfin agent. “The buyers who didn’t secure a home during the height of competition are now bidding low. For example, the same type of home that buyers were willing to offer $200,000 over list price are now offering $200,000 below list price.”
- In Denver, 47% of homes experienced reductions in price, the highest percentage of any major city.
- Even though price drops were common, median sale prices still increased in almost every metro in the county.
- Many pandemic-era migration hotspots, such as Tampa, Las Vegas, and West Palm Beach, had a large percentage of listings with price drops as well.
“As sellers with stale listings became increasingly anxious to get their properties sold, we saw a steep rise in price drops through the summer here in Washington State,” says Darlene Heseltine, a Tacoma, WA Redfin agent. “Currently, homes that are fresh on the market are starting to move more quickly. As mortgage rates dip further, in-demand properties may start receiving multiple offers.”
The top five cities with the highest share of price drops in 2022
City |
% of homes with price drops |
|---|---|
| Denver, CO | 47% |
|
42% |
|
|
40% |
|
|
40% |
|
|
39% |
Data includes the median price drops out of all active listings in each of the 50 largest metropolitan areas.
14. 55% of homes had a bidding war
55% of homes had bidding wars in 2022, down from 64% in 2021. Coastal metros experienced the highest rates of bidding wars, including Boston (69.8%) and Los Angeles (67.7%).
However, nationwide, bidding wars fell from 72% to 35% from February to November. A worsening economy, higher mortgage rates, and an increase in supply contributed to the slowdown.
Shauna Pendleton, a Boise, ID Redfin agent, advises sellers to be patient and wait for mortgage rates to drop. “Unless a home is priced $100,000 or more under market value, bidding wars are mostly non-existent. Our team still hears of a few multiple-offer situations; in these cases, it’s typically a luxury home in a high-demand neighborhood that is priced very aggressively.”
The top five metros with the highest percentage of bidding wars in 2022
City |
% of homes with bidding wars |
|---|---|
| 70.0% | |
|
69.8% |
|
|
67.7% |
|
|
67.4% |
|
| Philadelphia, PA |
67.3% |
Data includes the median percentage of bidding wars across active listings in each of the 50 largest metropolitan areas.
15. Over 30% of homes were purchased with cash in 2022
30.7% of homes were purchased with all cash, up 2% year over year. In October (the most recent data available), 32% of homes were paid for with all cash, up 2% year over year and the highest share since 2014.
- Florida was the most popular state for all-cash purchases, especially Jacksonville and West Palm Beach.
- Expensive west coast metros, including Oakland, San Jose, and Seattle, had the lowest share of all-cash purchases.
Data is from a Redfin analysis of county records across 39 of the most populous U.S. metropolitan areas, dating back through 2011. Data does not include November or December.
16. Real estate investors purchased nearly 20% of available listings, a new record
Vying to capitalize on the housing and rental boom, investors purchased 233,701 homes in 2022 through September, a record-breaking 19.1% of all listings. Multifamily residential properties constituted the largest percentage of investor market share, with an average of 30% of these properties being purchased by investors.
Pandemic boomtowns became the largest investor hotspots, especially in Sun-Belt metros.
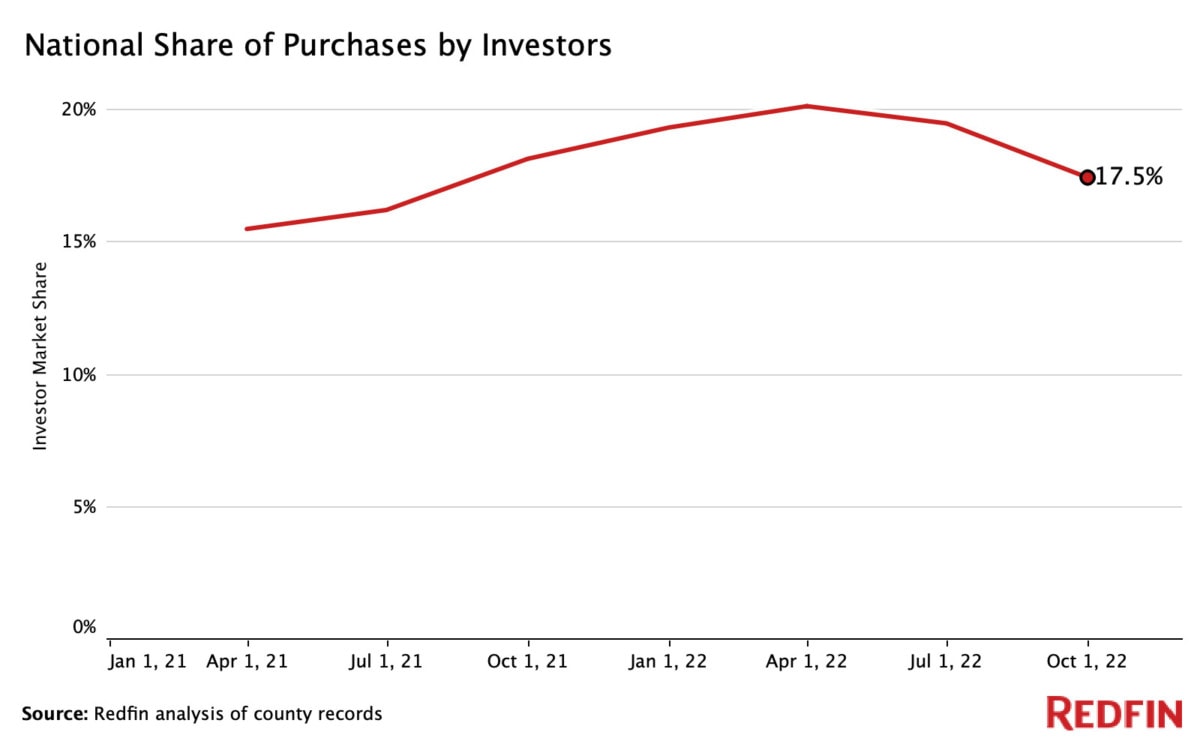
The top five metros with the largest investor market shares in 2022
City |
Average investor share |
Year-over-year change |
|---|---|---|
| Jacksonville, FL | 31.6% | +18.8% |
| 31% |
+14% |
|
| 29% |
+8% |
|
| 28.7% |
+14% |
|
| 28.6% |
+9.1% |
Data is analyzed on a quarterly basis and includes all property types unless otherwise stated. Total percentage is the average of data from January-September. Data does not include the last quarter of 2022.
17. Luxury home sales experienced their biggest year-over-year decline on record
In 2022, there were 258,733 luxury homes sold in the U.S., down 27% year over year and the biggest decline since 2012. Active listings dropped even further, falling by 32.7% year over year. The median sale price for a luxury home was $1,080,000, up 14.8% year over year. Prices reached their peak of $1,120,000 during the three months ending May, a 15.7% year-over-year increase. However, price growth, listings, and sales slowed significantly as demand cooled later in the year.
- In the three months ending November 30th, luxury home sales fell by 38.1%, the largest drop on record.
- Luxury homes spent an average of 32 days on the market through November, up 28.9% year over year
- Tampa was the fastest growing luxury market, with prices rising by 32.3% year over year
- Luxury home sales declined by 47% in San Jose, the biggest fall of any major metro
“In Seattle, luxury listings saw the largest reductions in price,” continues Seattle agent Christy Beach. “In the current market, most sellers with a price point of $1.5 million or higher need to prepare to make their home stand out among the competition. More often than not, sellers are having to negotiate their price and terms with buyers.”
Luxury homes are defined as the top 5% of listings in a given market. Values are three month moving aggregates ending on the date shown, e.g., November 2022 spans September, October, and November 2022. Data does not include the three months ending December 31.
Looking forward
The 2022 housing market was chaotic, but what does Redfin predict for 2023? Read our 2023 Housing Market Predictions to learn more.
All data was compiled by the week ending December 23, 2022. Data is aggregated from January to November and does not include December unless stated otherwise. All data is from Redfin, FRED, and/or public records. For questions about metrics, read our metrics definitions page.