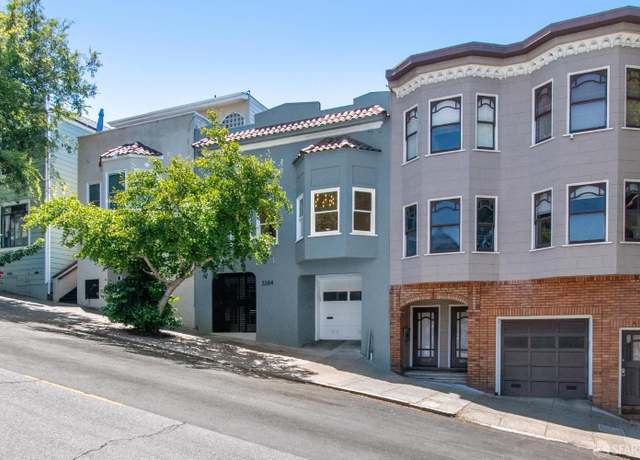
 3284 Folsom St, San Francisco, CA 94110
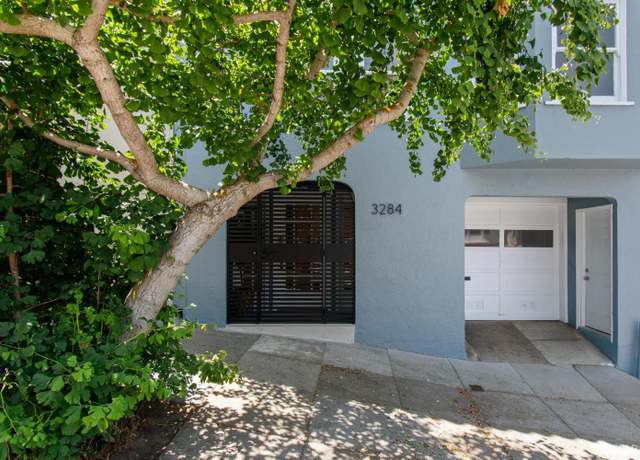 3284 Folsom St, San Francisco, CA 94110
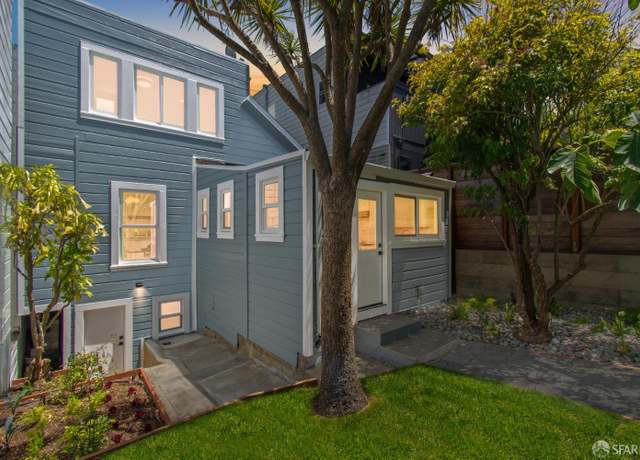 3284 Folsom St, San Francisco, CA 94110
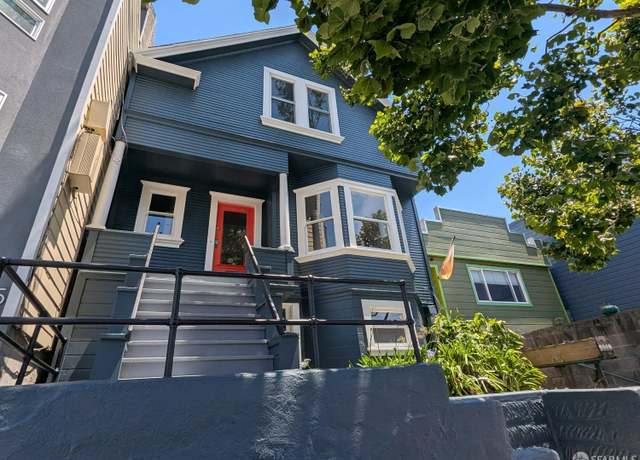 3639 Mission St, San Francisco, CA 94110
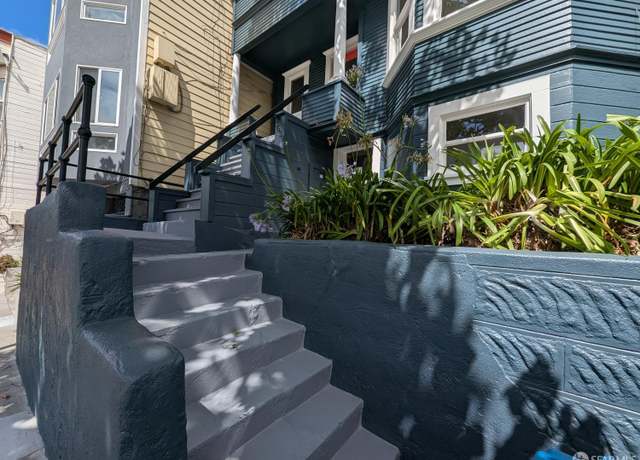 3639 Mission St, San Francisco, CA 94110
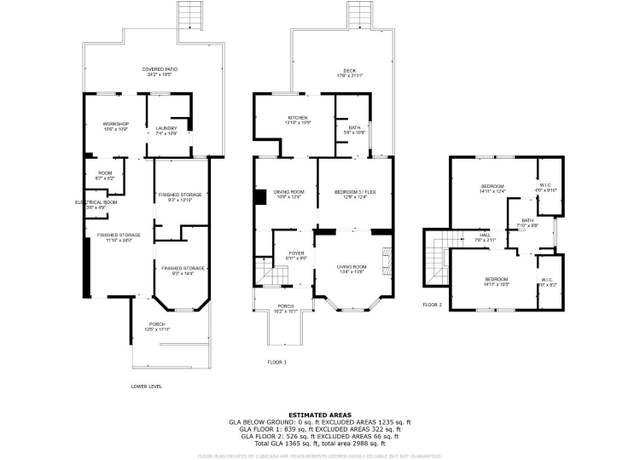 3639 Mission St, San Francisco, CA 94110
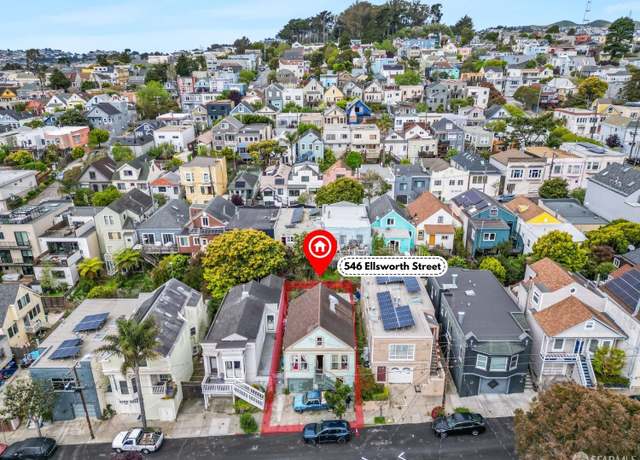 546 Ellsworth St, San Francisco, CA 94110
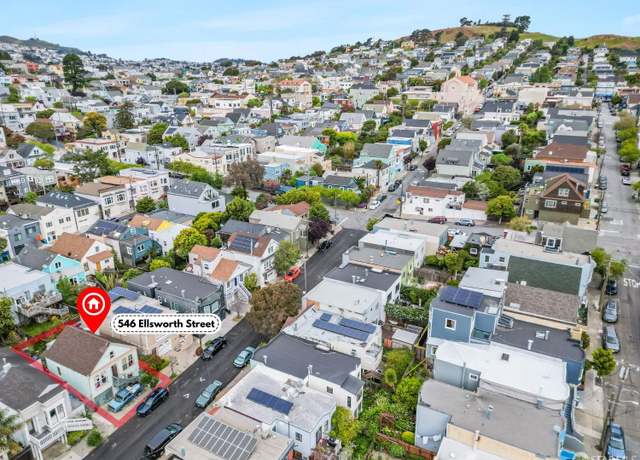 546 Ellsworth St, San Francisco, CA 94110
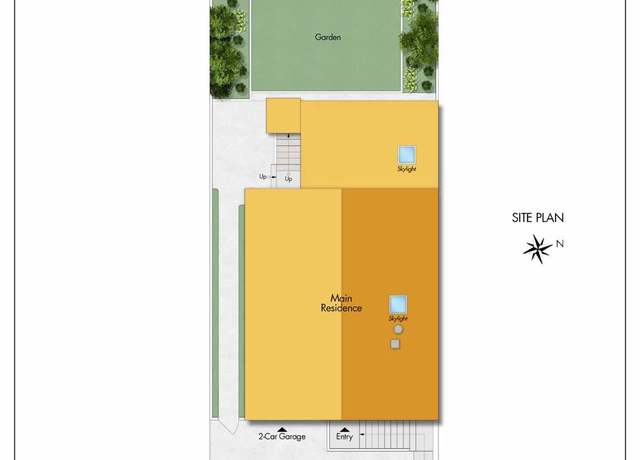 546 Ellsworth St, San Francisco, CA 94110
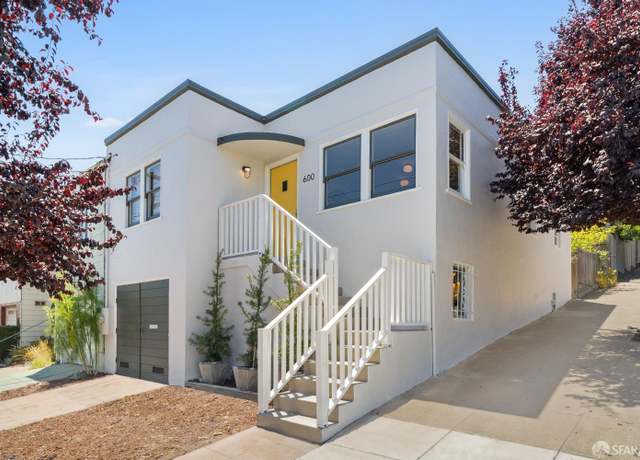 600 Ellsworth St, San Francisco, CA 94110
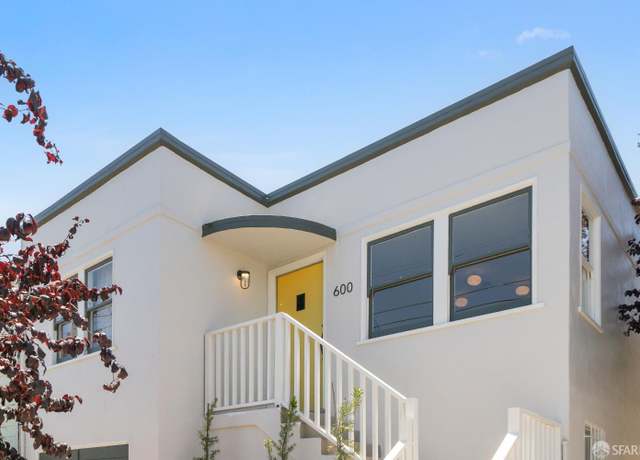 600 Ellsworth St, San Francisco, CA 94110
 600 Ellsworth St, San Francisco, CA 94110
 3954 Folsom St, San Francisco, CA 94110
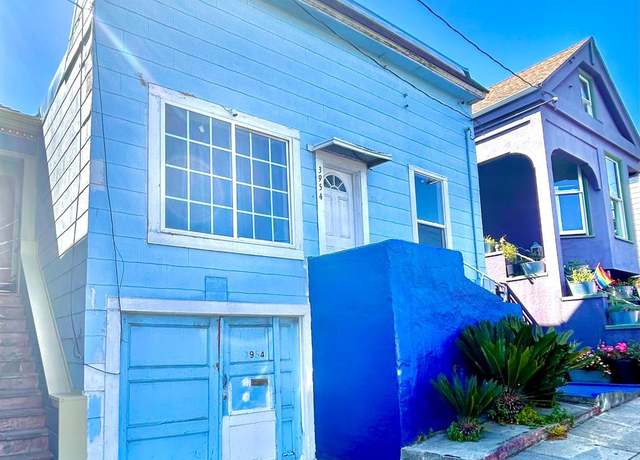 3954 Folsom St, San Francisco, CA 94110
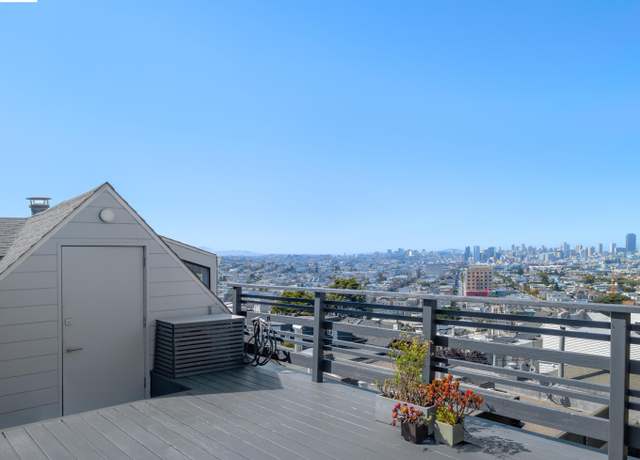 53 Elsie St, San Francisco, CA 94110
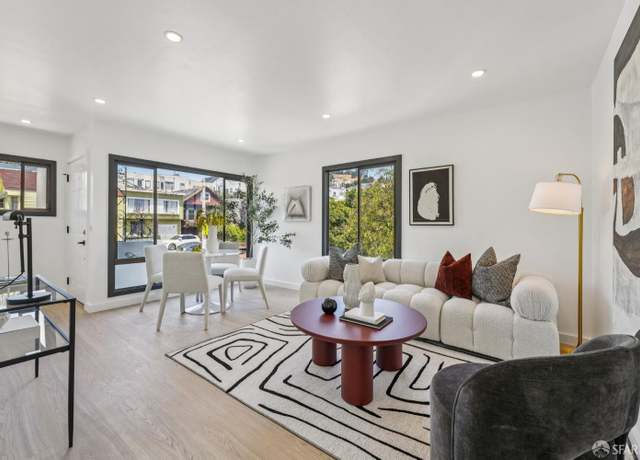 301 Banks St, San Francisco, CA 94110
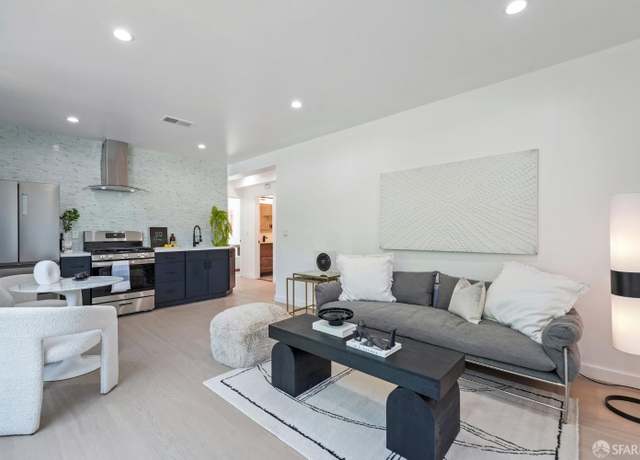 1100 Cortland Ave, San Francisco, CA 94110
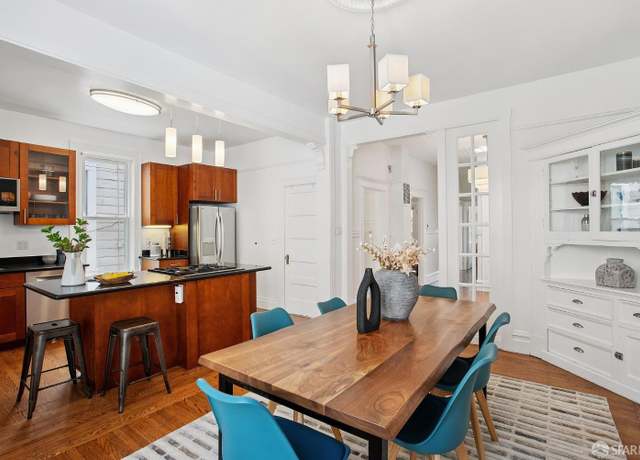 1483 Guerrero St, San Francisco, CA 94110
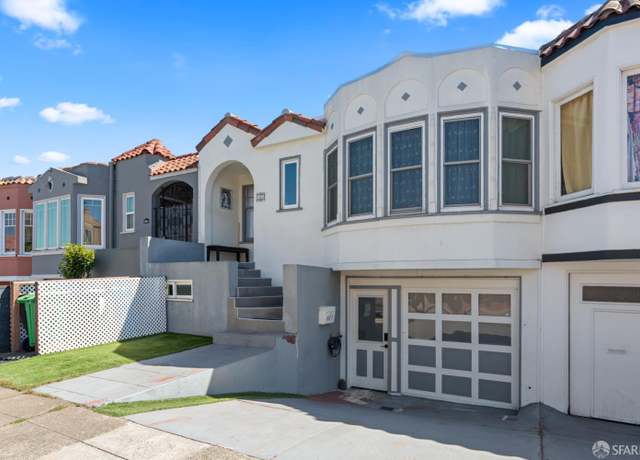 447 Justin Dr, San Francisco, CA 94112
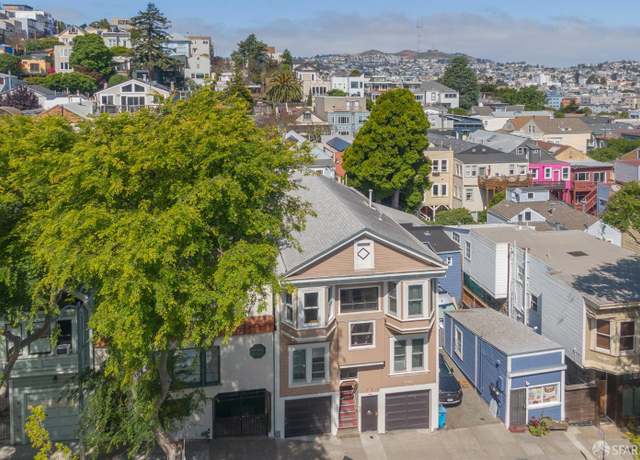 3248 Folsom St, San Francisco, CA 94110
 111 - 105 Richland Ave, San Francisco, CA 94110
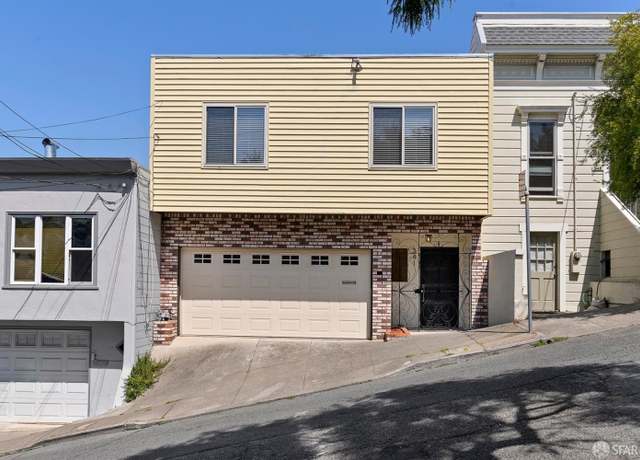 341 Prentiss St, San Francisco, CA 94110
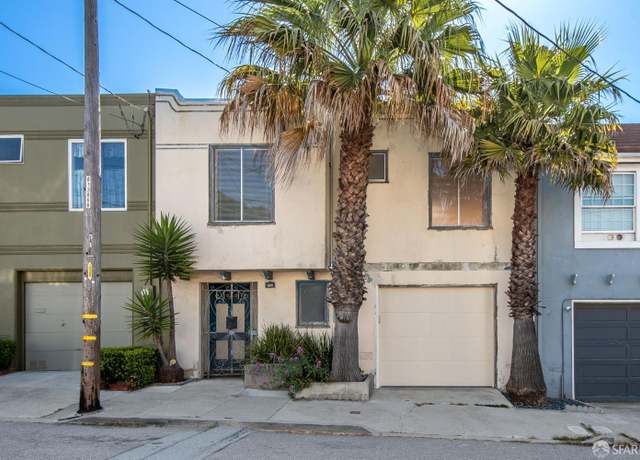 569 Peralta Ave, San Francisco, CA 94110
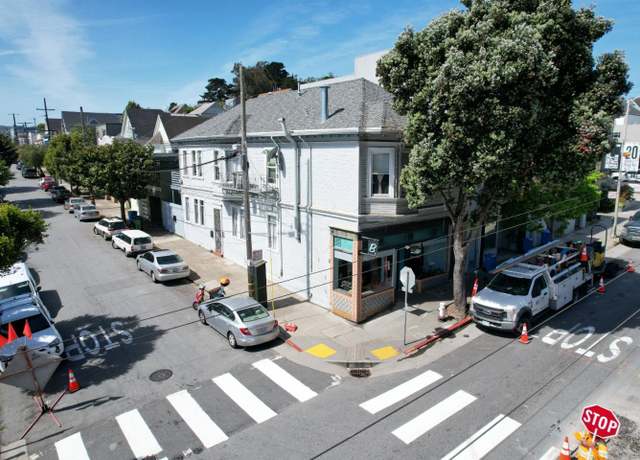 326 Cortland Ave, San Francisco, CA 94110
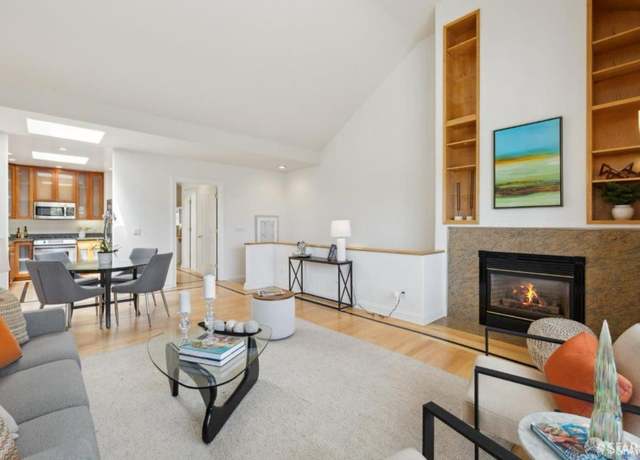 8 Milton St, San Francisco, CA 94112
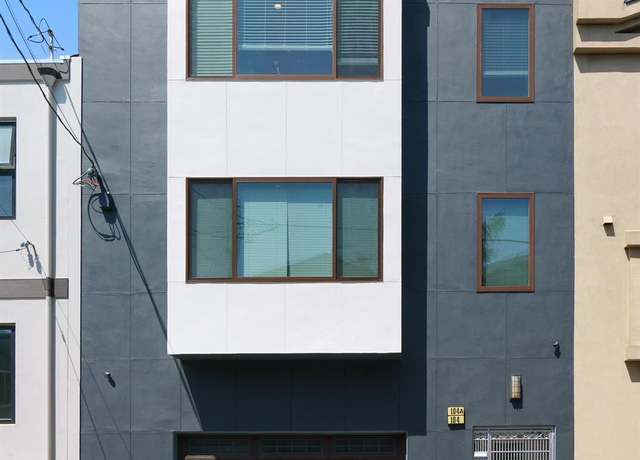 104 Bache St Unit A, San Francisco, CA 94110
 201 Richland Ave, San Francisco, CA 94110
 4107 Folsom St Unit A, San Francisco, CA 94110
 73 Leese St, San Francisco, CA 94110
 475 Justin Dr, San Francisco, CA 94112
 17 30th St, San Francisco, CA 94110
 656 Banks St, San Francisco, CA 94110
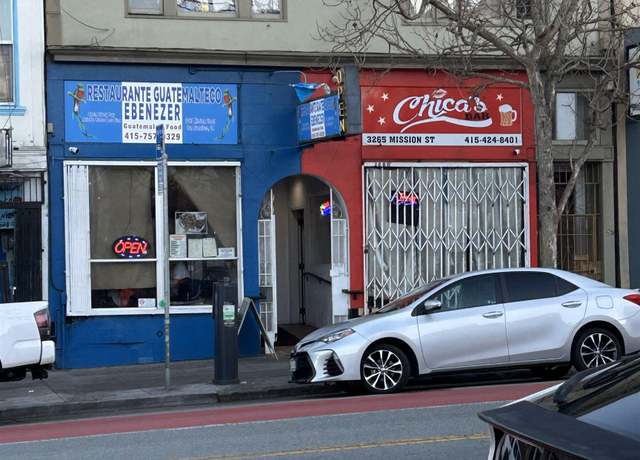 3265-7 Mission St, San Francisco, CA 94110
 334 Alemany Blvd #3, San Francisco, CA 94110
 3355 Mission St, San Francisco, CA 94110
 666 Peralta Ave, San Francisco, CA 94110
 108 Roscoe St, San Francisco, CA 94110
 106 Roscoe St, San Francisco, CA 94110
 76 Putnam St, San Francisco, CA 94110
 881 Moultrie St, San Francisco, CA 94110
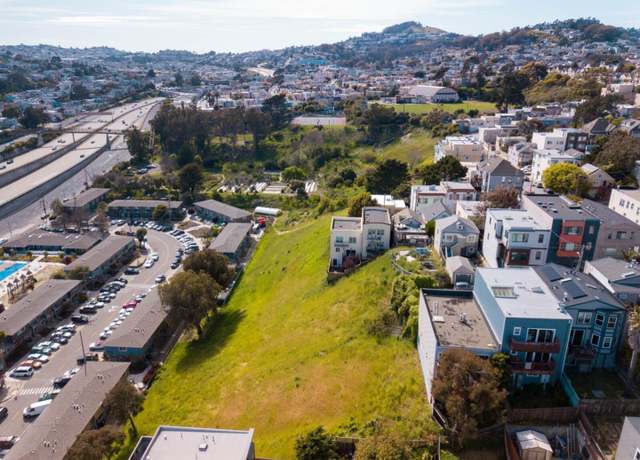 132 Bache St, San Francisco, CA 94110
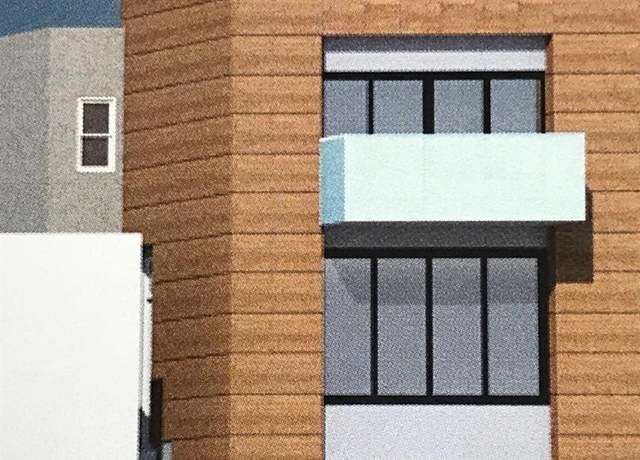 332 Bradford St, San Francisco, CA 94110
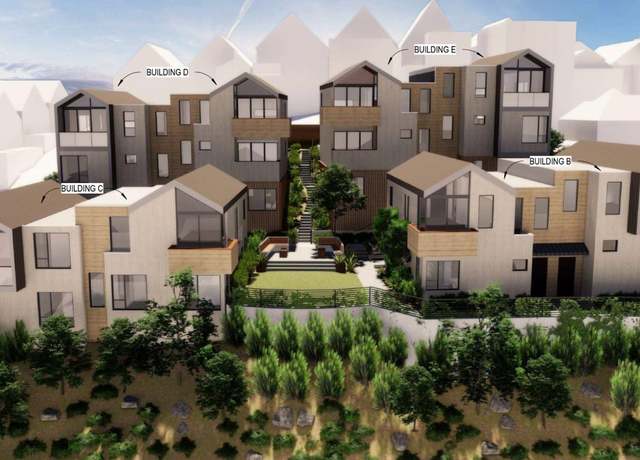 1513 York St, San Francisco, CA 94110
 886 Moultrie St, San Francisco, CA 94110
- Median Sale Price
- # of Homes Sold
- Median Days on Market
Median Sale Price (All Home Types)
$1,509,500
+0.6% YoY | Jun 2025
- 1 year
- 3 year
- 5 year
About us
Find us
Subsidiaries
Copyright: © 2025 Redfin. All rights reserved.
Updated January 2023: By searching, you agree to the Terms of Use, and Privacy Policy.
Do not sell or share my personal information.
REDFIN and all REDFIN variants, TITLE FORWARD, WALK SCORE, and the R logos, are trademarks of Redfin Corporation, registered or pending in the USPTO.
California DRE #01521930
Redfin is licensed to do business in New York as Redfin Real Estate. NY Standard Operating Procedures
New Mexico Real Estate Licenses
TREC: Info About Brokerage Services, Consumer Protection Notice
Rocket Mortgage is an affiliated business of Redfin. All mortgage lending products and information are provided by Rocket Mortgage, LLC | NMLS #3030; www.NMLSConsumerAccess.org. Licensed in 50 states. This site is not authorized by the New York State Department of Financial Services for mortgage solicitation or loan applications activities related to properties located in the State of New York. For additional information on Rocket Mortgage or to receive lending services in the State of New York, please visit RocketMortgage.com.
Rocket Mortgage, LLC, Rocket Homes Real Estate LLC, Rocket Card, LLC, RockLoans Marketplace LLC (doing business as Rocket Loans), and Rocket Money, Inc., are separate operating subsidiaries of Rocket Limited Partnership. Redfin Corporation is an affiliated business of Rocket Limited Partnership. Each company is a separate legal entity operated and managed through its own management and governance structure. Rocket Limited Partnership is an indirect, wholly owned subsidiary of Rocket Companies, Inc. (NYSE: RKT).
If you are using a screen reader, or having trouble reading this website, please call Redfin Customer Support for help at 1-844-759-7732.
 REDFIN IS COMMITTED TO AND ABIDES BY THE FAIR HOUSING ACT AND EQUAL OPPORTUNITY ACT. READ REDFIN'S FAIR HOUSING POLICY AND THE NEW YORK STATE FAIR HOUSING NOTICE.
 United States
 Canada